
Figure 5.
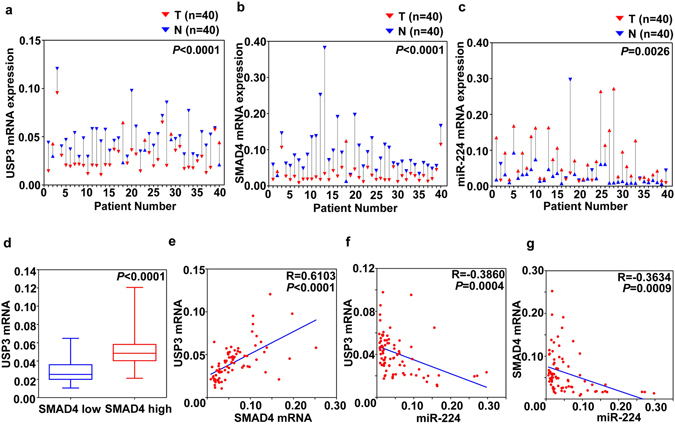
Expression and correlation of USP3, SMAD4 and miR-224 in primary CRC samples (a–c) USP3, SMAD4 and miR-224 expression in 40 paired primary CRC and adjacent non-cancer tissues were evaluated by qRT-PCR. (d) Comparison of the USP3 expression levels between “SMAD4 low” and “SMAD4 high” subgroups that were classified according to the median SMAD4 expression levels. (e–g) Correlation analyses of USP3 mRNA, SMAD4 mRNA and miR-224 were conducted in these CRC specimens.