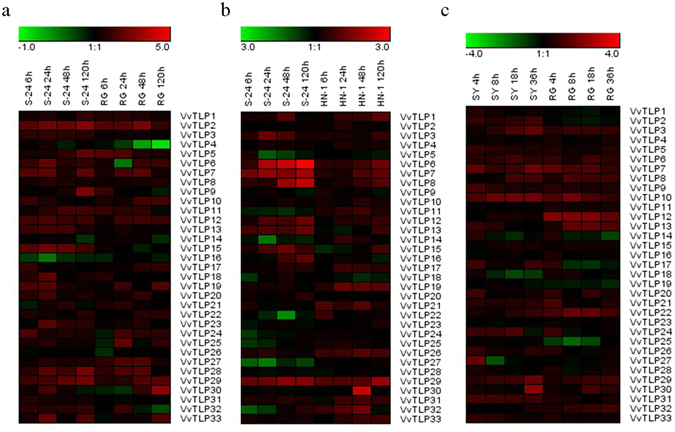
Figure 3.

Expression profiles of 33 VvTLP genes. The expression data from the semi-quantitative RT-PCR analyses were analyzed and visualized into heat maps using the Gene Tools software and MeV 4.8.1. The color scale represents relative expression levels, with red and green indicating increased or decreased transcript abundance, respectively. (a) Expression profiles of VvTLP genes following anthracnose (E. ampelina) inoculation (6, 24, 48 and 120 h) in both ‘Shang-24’ and Red Globe. (b) Expression profiles of VvTLP genes after powdery mildew (E. necator) inoculation (6, 24, 48 and 120 h) in both ‘Shang-24’ and ‘Hunan-1’. (c) Expression profiles of VvTLP genes in response to B. cinerea inoculation (4, 8, 18 and 36 h) in both ‘Shuangyou’ and Red Globe. ‘S-24’, ‘RG’, ‘HN-1’ and ‘SY’ represent names of corresponding grape varieties. Original results are shown in Supplementary Fig. S1. The experiments were repeated three times and the results were found consistent.
