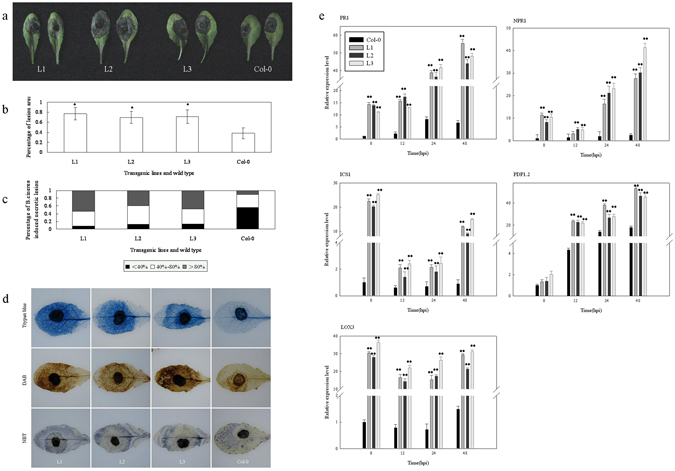
Figure 5.

Response of VqTLP29 over-expressing Arabidopsis thaliana lines to B. cinerea inoculation. (a) Disease symptoms in representative rosettes of the 4-week old VqTLP29 transgenic line L1, L2, L3 and Col-0 after B. cinerea inoculation for 3 days. Leaves were detached and inoculated by dropping 10 μl spore suspension with the concentration of 2.0 × 10⁶ spores ml−1 onto the adaxial surface. Leaves were highly moisturizing until the lesion shown. (b) Percentage of the leaves covered by the lesions 3 days post B. cinerea inoculation. Lesion sizes of the VqTLP29 transgenic lines and Col-0 were measured in three independent experiments using grid statistics. Data represent mean values ± SD with 50 leaves per sample. Asterisks indicate statistical significance (*0.01 < P < 0.05, one-way ANOVA). (c) Symptoms of the VqTLP29 transgenic lines and Col-0 3 days post B. cinerea inoculation were scored by defining three lesion classes (<40%, 40–80%, >80%). The black part represents percentage of B. cinerea induced necrotic lesion sizes less than 40%, the white part represents percentage of lesion sizes between 40% to 80%, and the gray part represents percentage of lesion sizes more than 80%. The sum of the percentages in three parts is 100%. (d) Cell death, H2O2 and O2− accumulation in the VqTLP29 transgenic lines and Col-0 72 h post B. cinerea inoculation. Three infected leaves of the transgenic lines and Col-0 were required for each stain in three independent experiments. (e) Expression levels of disease resistance genes in the VqTLP29 transgenic lines and Col-0 at 0, 12, 24 and 48 hpi following B. cinerea inoculation. Asterisks indicate statistical significance (*0.01 < P < 0.05, **P < 0.01, one-way ANOVA). The experiments were repeated three times with consistent results.
