Figure 1.

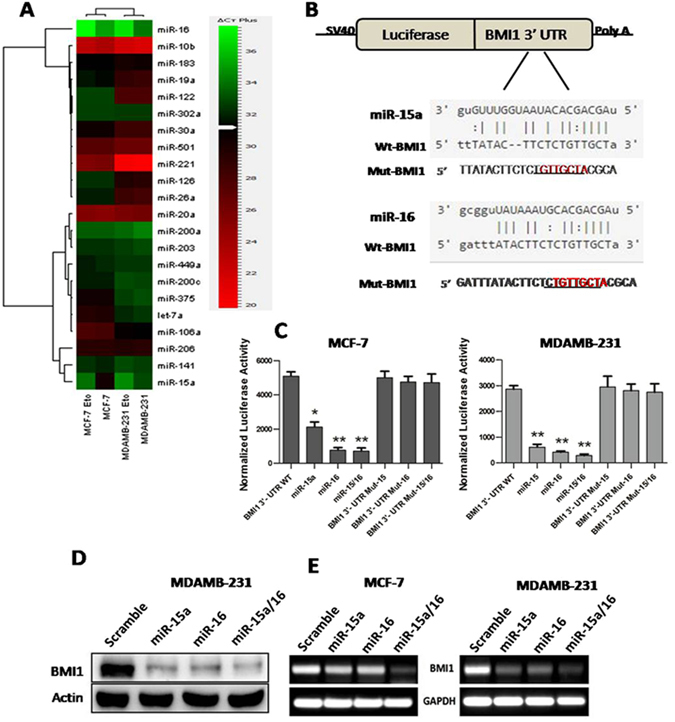
miR-15a/16 expression is altered in chemically induced DNA damage and it suppresses the BMI1 expression by targeting 3′UTR. Heat map showing the endogenous expression of miRNAs. The Green colour in the heat map indicates decreased and red colour indicates increased mRNA expression level. U6 was used as endogenous control (A). Predicted miRNA sequences and their recognition sites within 3′UTR of BMI1 (B) Renilla luciferase reporter assay showing the reporter expression in MCF-7 and MDAMB-231 cells co-transfected with wild-type 3′UTR of BMI1and mutant 3′UTR of BMI1 along with miR-15a, miR-16. Scramble miRNA vector used as a control. Renilla luciferase activity was normalized to firefly luciferase. n = 3, Students t-test was used to generate P values, *, ** and*** indicates P value summary (C,D). Western blot and RT-PCR data showing the expression of BMI1 upon overexpressed miR-15a, miR-16 and both. Blots were cropped to enhance the representation (E).
