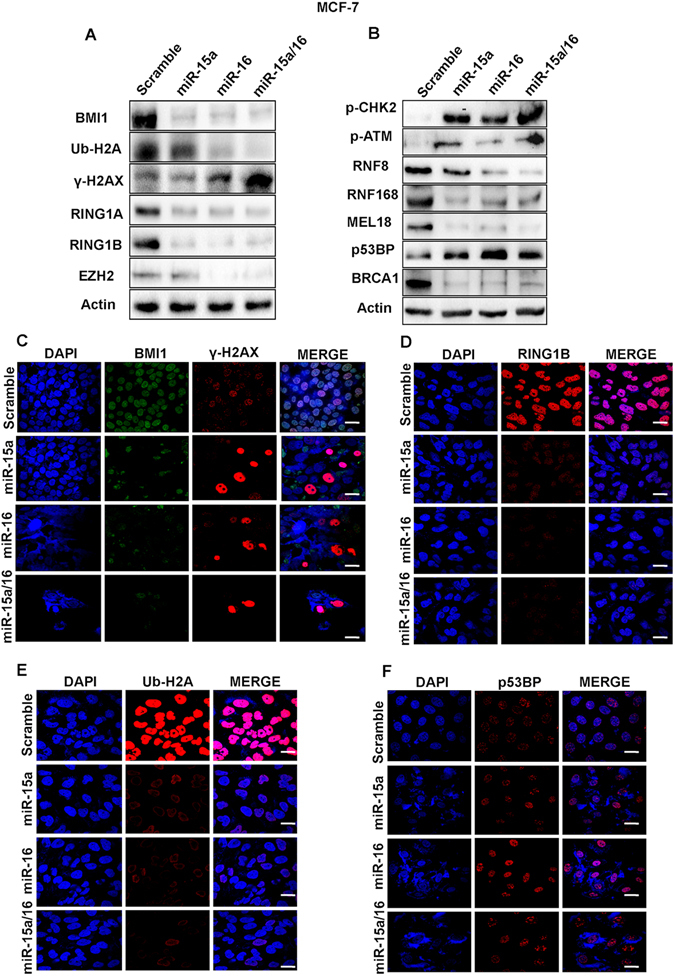
Figure 4.

Western blot analysis showing the expression of BMI1, RING1A, RING1B, EZH2, γ-H2AX, Ub-H2A, p-CHK2, p-ATM, RNF8, RNF168, MEL18, p53BP, BRCA1 proteins in MDAMB-231cells transfected with miR-15a, miR-16 or both miR-15a/16 under etoposide-induced DNA damage conditions. Actin served as a gel loading control. Blots were cropped to enhance the representation (A,B). Immunofluorescence data showing accumulation of BMI1, ϒ-H2AX (C) RING1B (D) and Ub-H2A (E) p53BP (F) in MDAMB-231 cells transfected with miR-15a miR-16 or both miR-15a/16 under etoposide- treated conditions. Bar indicates 200 μm.
