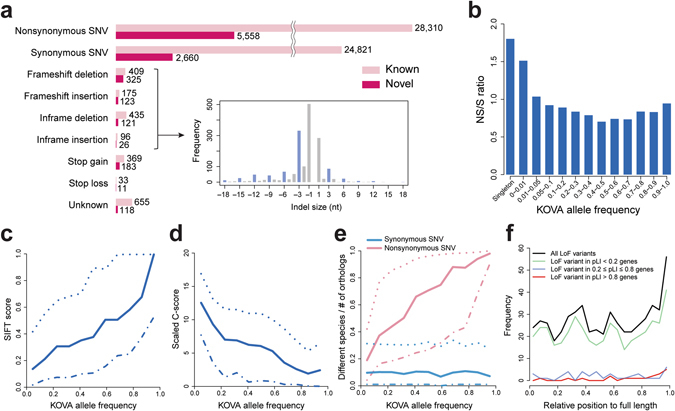
Figure 2.

Functional analysis of KOVA coding variants. (a) Numbers of novel and known variants categorized by function. The overlaid plot shows size distribution of indels, with the blue bar indicating multiples of three bases. (b) Nonsynonymous to synonymous SNV (NS/S) ratio by variant allele frequencies. (c) SIFT score and (d) Scaled C-score (CADD) by allele frequencies. (e) Degree of amino acid conservation of variant residues by allele frequencies. Fraction of species numbers with different amino acid on orthologous proteins compared to human orthologs. (f) Relative position of loss-of-function (LoF) variants on protein. Solid, dotted, and dash-dot lines in c-e indicate median, upper, and lower quantiles, respectively.
