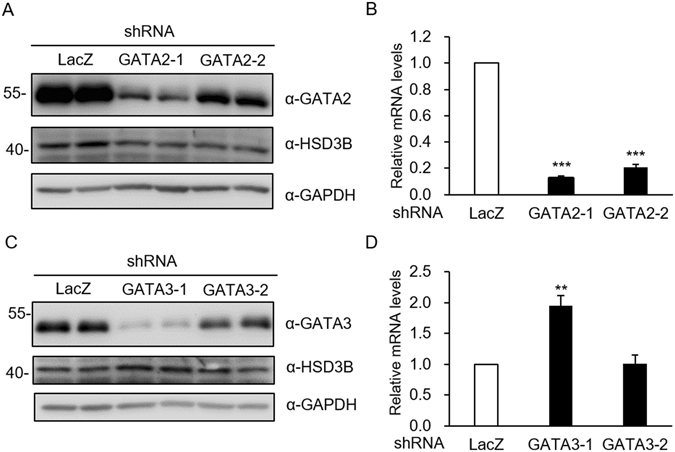
Figure 6.

Effects of GATA2 or GATA3 knockdown on HSD3B1 expression. JEG-3 cells were transfected with shRNA specific for GATA2, GATA3, or LacZ (negative control). (A,C) Cell lysates were analysed by western blot analysis. (B,D) RNA was extracted and quantified by qRT-PCR. Values are means ± SEM of three independent experiments. **P < 0.01, ***P < 0.001 compared with the control LacZ (Student’s t-test). Uncropped images of blots were shown in Supplementary Fig. S6.
