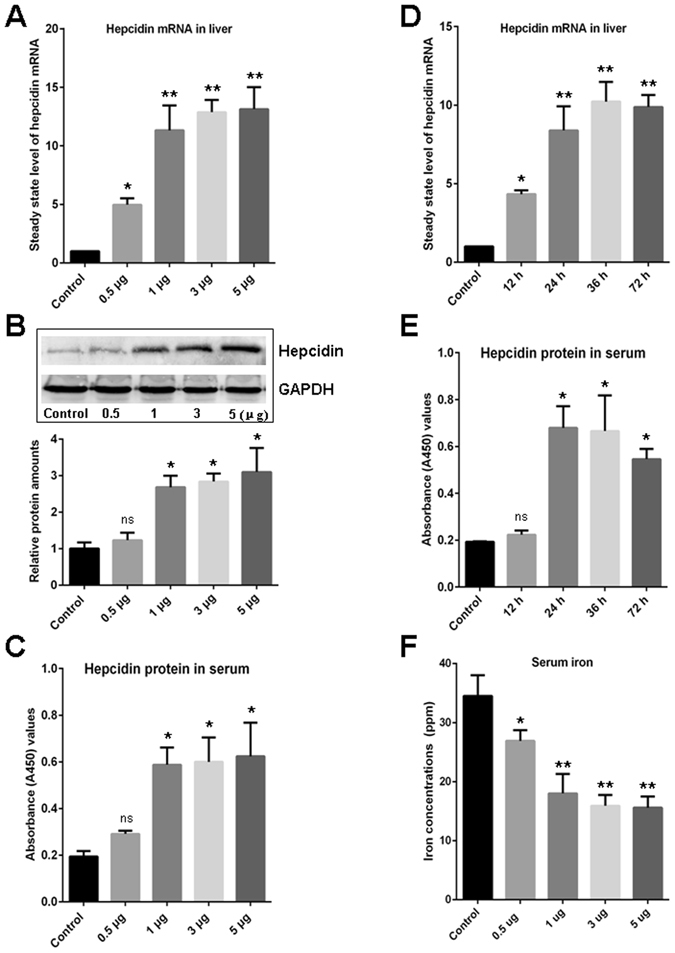
Figure 1.

Evaluation of the induced expression of hepcidin and reduced serum iron concentration upon A. hydrophila DNA stimulation. (A) Detection of the steady state level of hepcidin mRNA in liver upon stimulation with various concentrations of A. hydrophila DNA (0.5, 1, 3, and 5 μg per fish) by Q-PCR. (B and C) Detection of the hepcidin protein level in serum upon stimulation with various concentrations of A. hydrophila DNA (0.5, 1, 3, and 5 μg per fish) by Western blot (B) and ELISA (C), and the gray value of the relative signal intensity (hepcidin/GAPDH) in Western blot analysis was calculated using ImageJ program and depicted in a bar graph. (D) Time-dependent upregulation of the steady state level of hepcidin mRNA in liver upon stimulation with A. hydrophila DNA (1 μg per fish) as determined by Q-PCR. (E) Time-dependent upregulation of the hepcidin protein in serum upon stimulation with A. hydrophila DNA (1 μg per fish) as determined by ELISA. (F) Reduced concentrations of serum iron stimulated by A. hydrophila DNA (0.5, 1, 3, and 5 μg per fish) were detected by ICP-MS. The control groups in each experiment (indicated as Control) received mock PBS. The steady state level of hepcidin mRNA in liver was calculated by 2−ΔΔCT method normalized to β-actin. All data are representative of at least three independent experiments. A significant difference was detected between each experimental and control group. *p < 0.05, **p < 0.01. ns for not significant. The full-length blots are presented in Supplementary Fig. S4.
