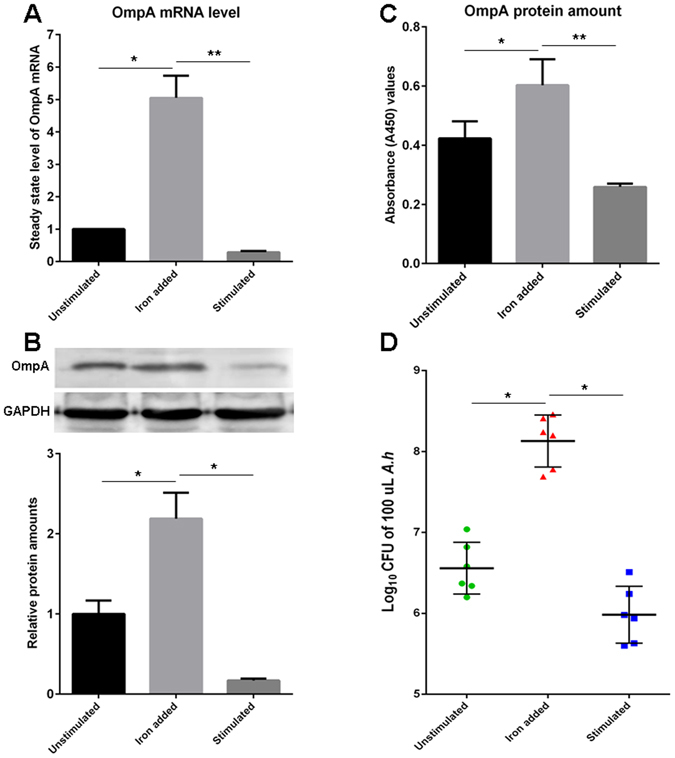
Figure 4.

Evaluation of OmpA expression on A. hydrophila cells upon iron-deficient serum stimulation and bacterial susceptibility to complement attack. (A, B, and C) The steady state level of OmpA mRNA or the amount of OmpA protein in A. hydrophila cells cultured in the presence of unstimulated serum (Unstimulated), A. hydrophila DNA (1 μg per fish) stimulated serum plus 10 μM Fe2+ supplemented ones (Iron added), and A. hydrophila DNA stimulated serum (Stimulated) was detected by Q-PCR (A), Western blot (B) and ELISA (C). The gray value of the relative signal intensity (OmpA/GAPDH) in Western blot analysis (B) was calculated using ImageJ program and depicted in a bar graph. All data are representative of at least three independent experiments. (D) Evaluation of the log10 CFU of 100 μL A. hydrophila under the attack of guinea pig serum (diluted to 5% as the complement source). A. hydrophila cultured in the presence of differently treated serum samples followed by co-incubation with guinea pig serum. The green round spots (Unstimulated) showed Log10 CFU of 100 μL A. hydrophila incubated with normal serum (n = 6), the red triangles (Iron added) showed Log10 CFU of 100 μL A. hydrophila incubated with A. hydrophila DNA stimulated serum added with 10 μM iron (n = 6), and the blue squares (Stimulated) showed Log10 CFU of 100 μL A. hydrophila incubated with A. hydrophila DNA stimulated serum (n = 6). The bars in the middle of each group mean average value. The steady state level of OmpA mRNA in A. hydrophila cells was calculated by 2−ΔΔCT method normalized to 16 s rRNA. *p < 0.05, **p < 0.01. The full-length blots are presented in Supplementary Fig. S5.
