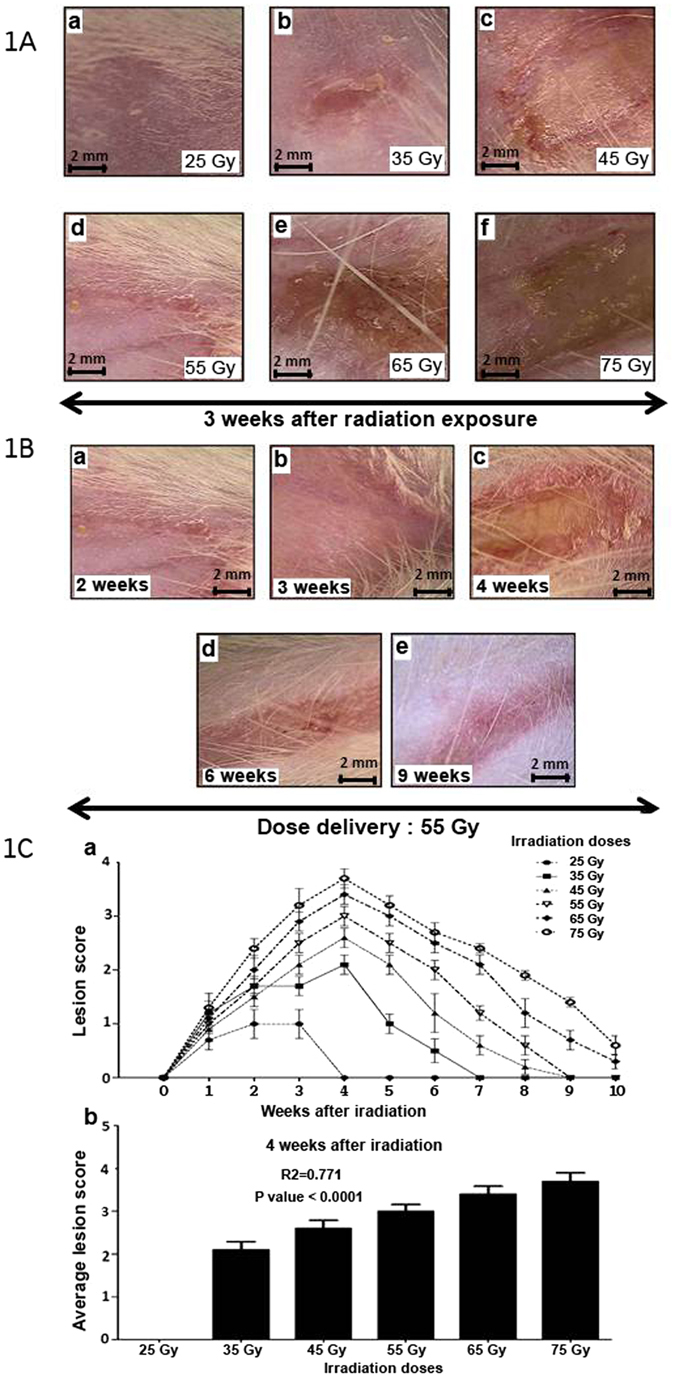
Figure 1.

Skin lesions based on radiation dose in a radiation-induced dermatitis model. (A) Photographs of radiation-induced lesions 3 weeks post-exposure: (a) 25 Gy, (b) 35 Gy and (c) 45 Gy, (d) 55 Gy, (e) 65 Gy, (f) 75 Gy. (1B) Macroscopic time-lapse observation of skin lesions following 55 Gy exposure. (1C) (a) Severity of lesions. (b) Average lesion score 4 weeks after irradiation. 14 groups (n = 10 rats in each group). The first group consisted of un-irradiated rats. Five groups were irradiated at 25, 35, 45, 55, 65, and 75 Gray (Gy). Each group of animals comprised 10 Sprague Dawley rats. Comparison by ANOVA followed by the Mann-Whitney or Dunnett’s test for group pair-wise comparisons. Data represent mean ± SEM, ns: not significant, *p < 0.05, **p < 0.01, ***p < 0.001.
