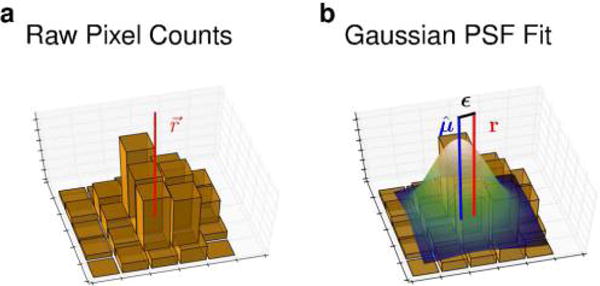
Figure 7.

Measurement error affects particle localization. (a) 2D histograms contain photon numbers detected (by a CCD camera, say) along the x and y coordinates with the true molecular position (r) indicated by the point at which the solid vertical red line intersects with the x,y-plane. (b) In order to localize a static point emitter, the histogram may be fit to a PSF (e.g., a Gaussian or an Airy function) illustrated by a color surface contour. The estimate of the emitter’s position, μ, shown by a solid vertical blue line, is approximated from the PSF. The difference between μ and r is the localization error ε. Factors such as photon count, exposure time, pixel size and background autofluorescence all contribute to ε.
