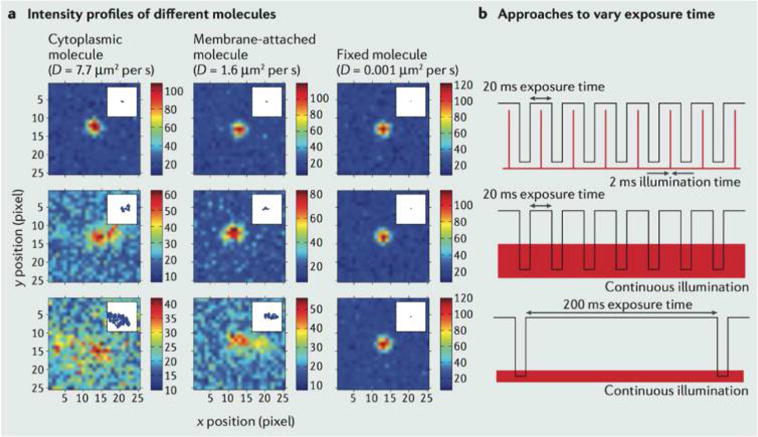
Figure 8.

Motion and optics affect measurement noise. The simulated images illustrate how thermal motion, inherent to nanoscale measurements, affect the intensity profile of three molecules with different (given) diffusion coefficients D (describing the diffusion of cytoplasmic, membrane- attached and fixed/immobile molecules) shown in the columns of panel (a). (a) The estimated point spread function (PSF) measured for different molecules under alternate illumination strategies (shown in the rows). The color bar displays the number of photons collected. (b) The illumination strategies are stroboscopic (top), continuous illumination with short camera exposure time (middle), continuous illumination with long camera exposure time (bottom). The two-state signals shown denote the state of the shutter (open/closed) and laser (on/off). The localization precision (accuracy and uncertainty) is affected by how accurately the PSF can be inferred from digital images produced by tagged molecules. The plots from panel (a) demonstrate how some molecular and sampling parameters affect measurement noise statistics when the PSF is used to infer the molecular position. “Smearing” of the PSF, induced by motion blur when a simulated molecule spans an area covered by different pixels in a single frame, introduces a new source of position uncertainty (in addition to the localization noise described in Figure 7). Reproduced with permission from ref 97. Copyright 2013, Nature Publishing Group.
