
Figure 2.
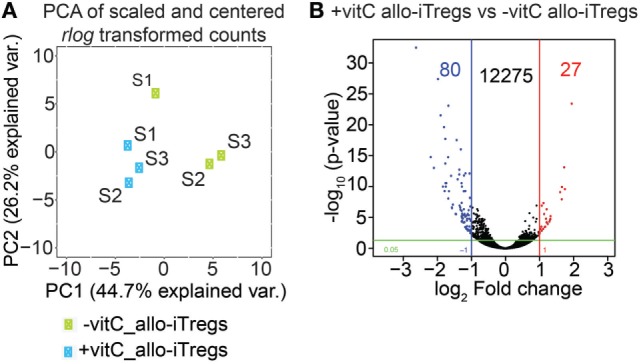
Vitamin C has only little influence on transcriptome of allo-iTregs. On day 6, Foxp3RFP+ cells were sorted from allo-iTreg cultures (±vitamin C), and total RNA was isolated from these cells for RNA-seq analysis. (A) Principal component analysis (PCA) of mean centered and scaled rlog-transformed read count values of RNA-seq data from −vitamin C allo-iTregs and +vitamin C allo-iTregs. Three replicates (S1, S2, and S3) are depicted for each condition (green symbols: −vitamin C allo-iTregs; blue symbols: +vitamin C allo-iTregs). (B) Volcano plot indicating number of differentially expressed genes between –vitamin C allo-iTregs and +vitamin C allo-iTregs according to the following criteria: |log2 (FC)| ≥ 1 and p-value ≤ 0.05. Data were generated from three independent experiments.