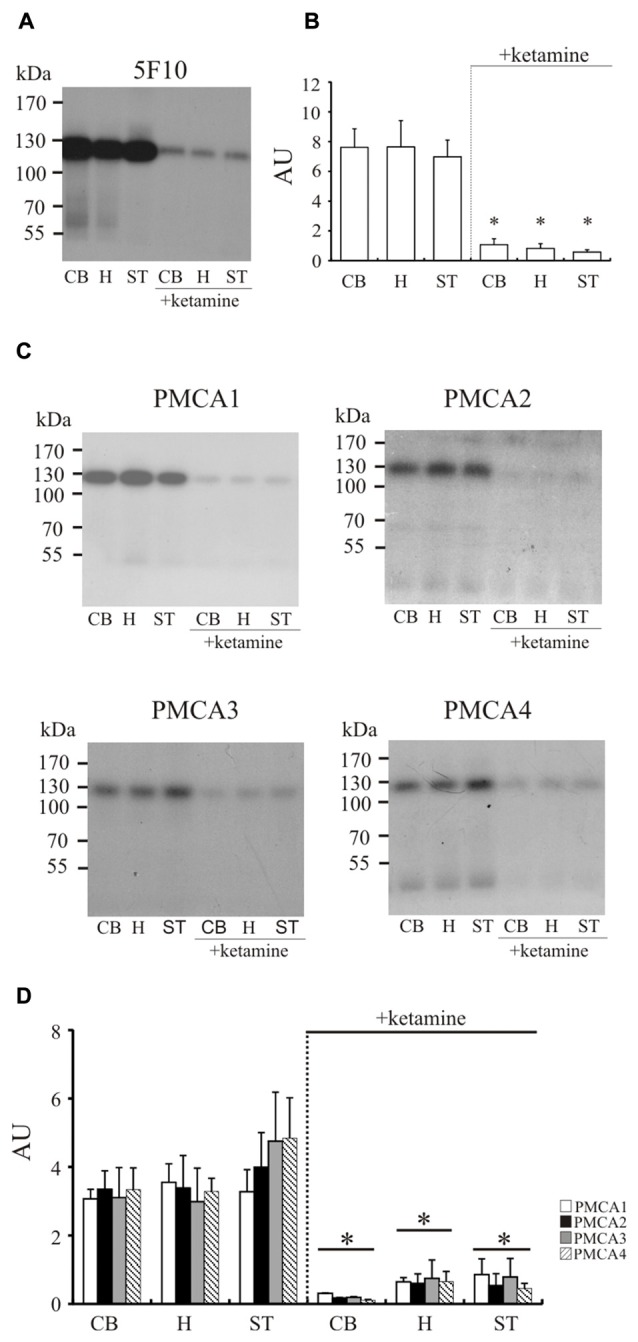
Figure 3.

The measurement of phosphointermediate formation. Synaptosomal membranes were phosphorylated with 0.3 μM γ32-ATP, immunoprecipitated with 5F10 (A) or isoform-specific antibodies (C) and exposed to X-ray films for 3–5 days as described in “Materials and Methods” Section. The optical density (OD) of bands corresponding to the total amount of phosphoenzyme formed (B) or to particular PMCA phosphoisoform amount (D) was densitometically quantified. The results are presented as arbitrary units (AU) expressed as OD/mg protein. Representative autoradiograms are shown. *P < 0.05 ketamine treated vs. saline, n = 5. CB, cerebellum; H, hippocampus; ST, striatum.
