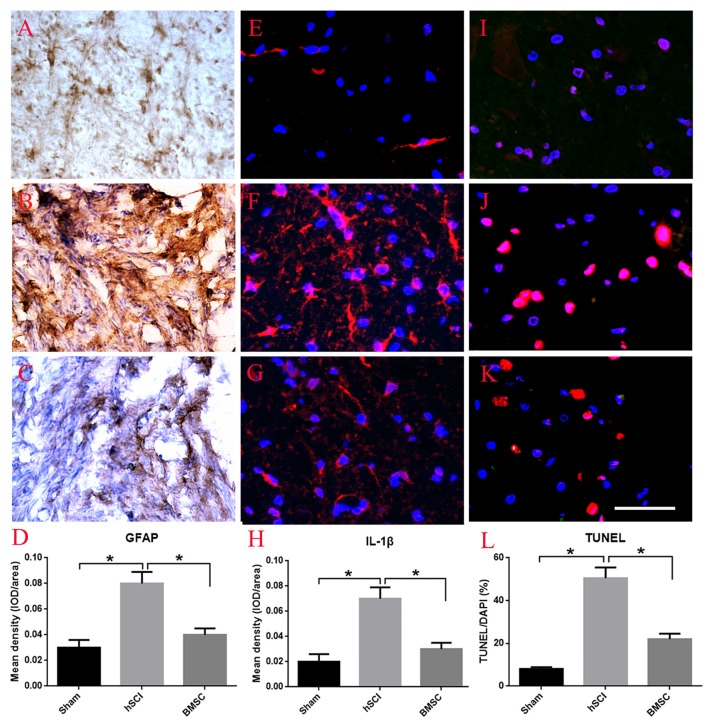
Figure 6.
Effect of BMSC transplantation in reducing scar formation, anti-inflammation and apoptosis after hSCI in tree shrews. (A) Intact morphology of spinal cord in the sham group. (B) Scar formation labeled by GFAP staining in the hSCI group. (C) Scar formation labeled by GFAP staining in the BMSC transplantation group. (D) Quantitative analysis for the mean density of GFAP among the sham, hSCI, BMSC groups, which indirectly reflect scar formation. (E–G) Immuno-fluorescent staining of interleukin 1 beta (IL-1β) in the sham, hSCI, and BMSC groups. The mean density of IL-1β (IOD/area) is showed in (H), which was analyzed using Image-Pro plus 6.0 software. (I–K) Cell apoptosis in the sham, hSCI, and BMSC groups. (L) Quantitative histogram representing the percent of terminal-deoxynucleoitidyl transferase mediated nick end labeling (TUNEL)/DAPI. *p < 0.05 compared with hSCI group. Data is presented as the means ± SD (n = 5, one-way ANOVA). Bar = 50 μm. BMSC group is hSCI + BMSCs group.

