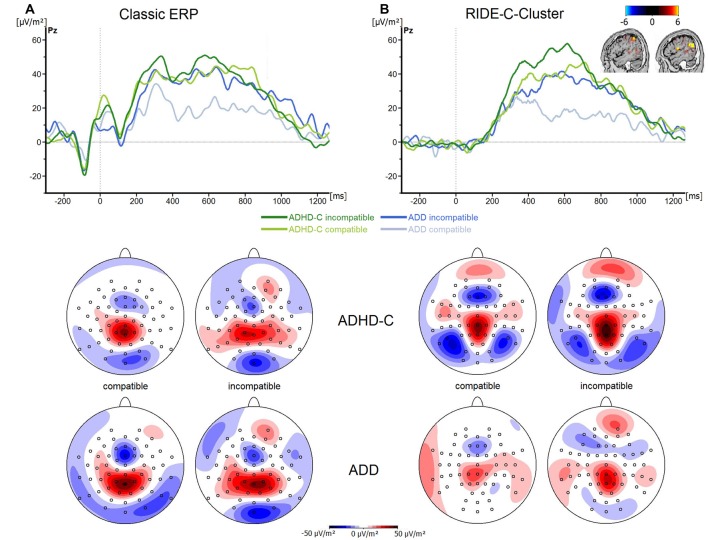
Figure 4.
(A) Stimulus-locked waveforms (CSD) for the P3 component and (B) the equivalent RIDE-component, depicted for both ADHD subtypes and for compatible and incompatible flanker trials at electrode Pz. Point 0 denotes the onset of the target stimulus. Topographic maps are also shown—blue denotes negative deflections whereas red reflects positive ones.

