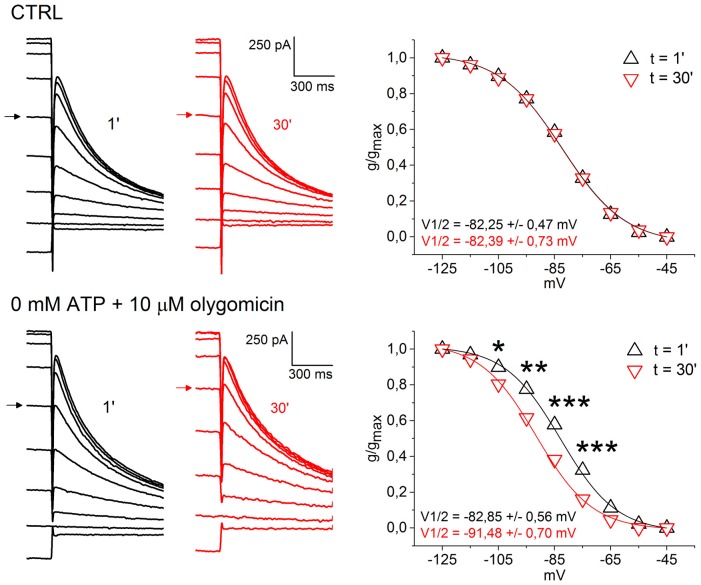
Figure 6.
Low intracellular ATP causes a negative shift in Ih activation curve. Top, example of voltage clamp recordings at 1 min (black) and 30 min (red) after patch rupture with control pipette solution. Respective Ih activation curves show perfect overlap (right). Bottom, same experiment, but using a pipette solution with 0 mM ATP and 10 μM oligomycin. Ih activation curve at 30 min is left-shifted by ~9 mV (right). Arrows indicate current traces obtained at the −85 mV test potential to highlight the shift in voltage dependence.

