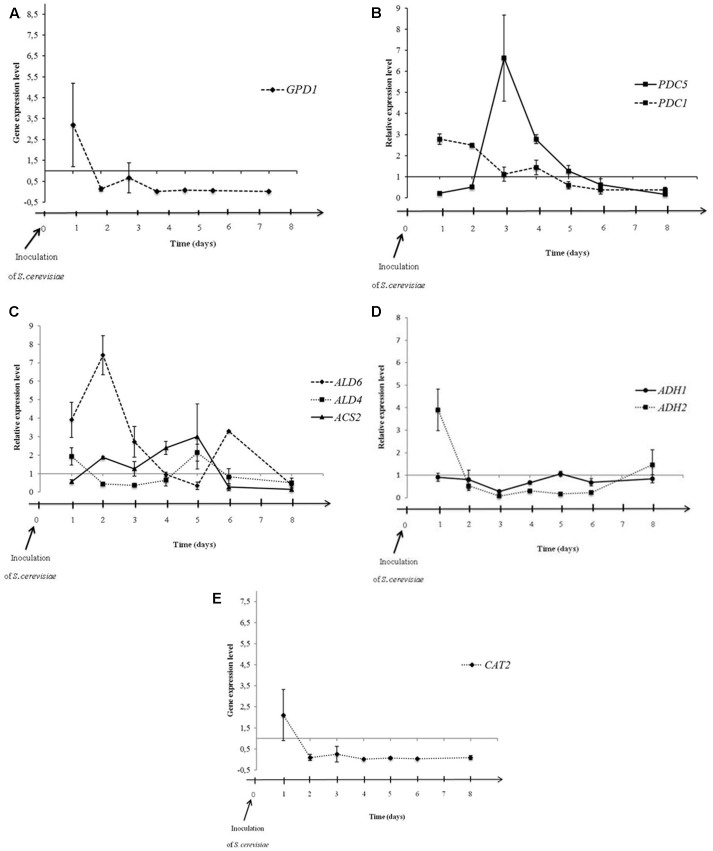
FIGURE 4.
Expression levels of GPD1 (A), PDC1 and PDC5 (B), ALD6, ALD4, and ACS2 (C), ADH1 and ADH2 (D), and CAT2 (E) in S. cerevisiae PB2023 at different stages of sequential culture fermentation. Data are representative of three independent trials. The gene expression levels were given as a differential of the expression levels in S. cerevisiae in sequential culture conditions versus expression levels of S. cerevisiae in pure culture.

