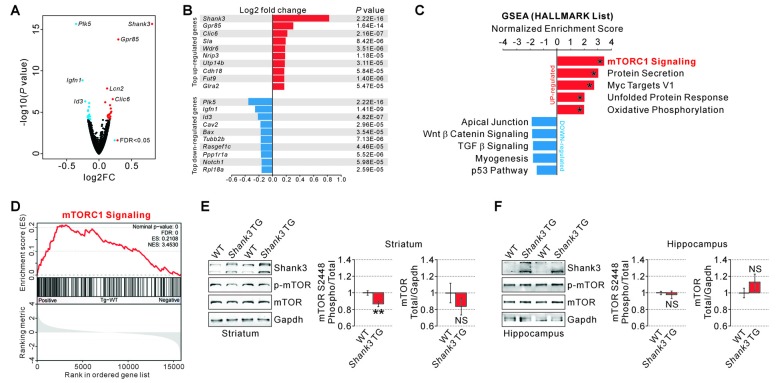
Figure 1.
RNA-seq analyses and measurements of mammalian target of rapamycin complex 1 (mTORC1) activity in the SH3 and multiple ankyrin repeat domains 3 (Shank3) transgenic (TG) striatum. (A) Volcano plot for the striatal RNA-seq analysis of Shank3 TG mice. Differentially expressed genes (DEGs), defined by false discovery rate (FDR) < 0.05, are shown as blue (down-regulated) and red (up-regulated) circles. FC, fold change. The complete lists of RNA-seq analysis and DEGs are provided in the Supplementary Tables S2, S3. (B) List of top 10 up-regulated and down-regulated DEGs (based on the fold changes) from the striatal RNA-seq analysis of Shank3 TG mice. (C) The bar graph shows normalized enrichment scores (NES) of gene set enrichment analysis (GSEA) on the Hallmark gene sets for the striatal RNA-seq analysis of Shank3 TG mice. Asterisks indicate the gene sets with an FDR of less than 0.05. The complete list that contains the results of GSEA analysis is provided in Supplementary Table S4. (D) The enrichment plot of striatal RNA-seq analysis of Shank3 TG mice on the mTORC1 signaling gene set. The complete list of mTORC1 signaling genes within the Shank3 TG RNA-seq analysis is provided in Supplementary Table S5. (E) Representative Western blot images and quantifications show that mTORC1 activity measured by mTOR S2448 phosphorylation is decreased in the striatum of Shank3 TG mice. The total mTOR expression level is not significantly different between wild-type (WT) and Shank3 TG striatum. Data are presented as mean ± SEM (n = 10 animals per genotype; **P < 0.01, unpaired two-tailed Student’s t-test). (F) Normal mTORC1 activity and total mTOR protein levels in the hippocampus of Shank3 TG mice (n = 6 animals per genotype).

