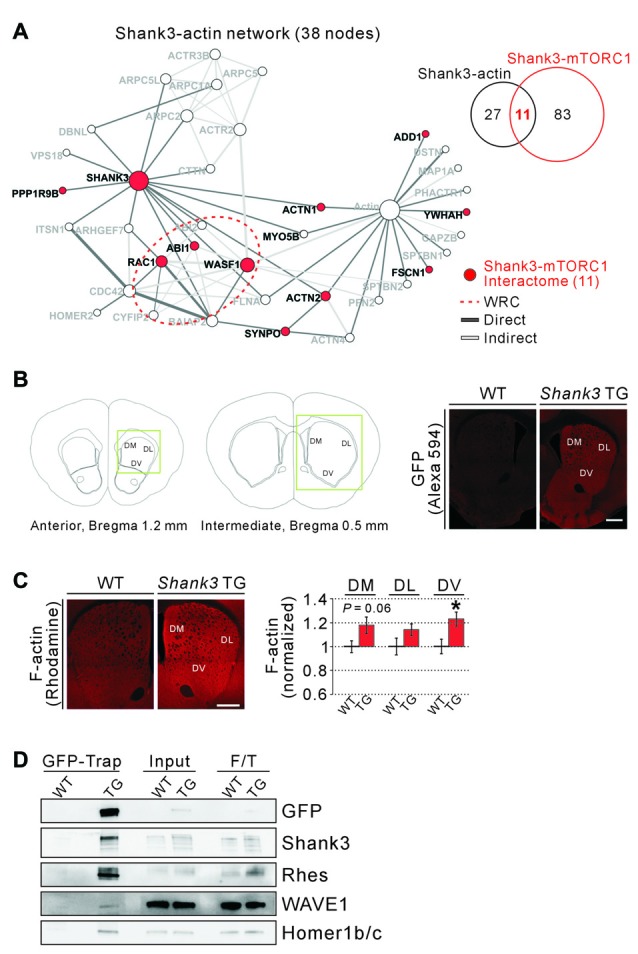
Figure 3.

Actin-related proteins in the Shank3-mTORC1 interactome, and increased F-actin levels in the Shank3 TG striatum. (A) The actin-related subnetwork of Shank3 interactome where the 11 proteins shared by the Shank3-mTORC1 interactome are colored in red. The edges of the network are colored depending on the type of interactions (direct or indirect interaction). The red dotted circle indicates the components of wave regulatory complex (WRC; WASF1; Abelson-interacting protein 1 (ABI1), ABI2 and Cytoplasmic FMR1-interacting protein 2 (CYFIP2) and Ras-related C3 botulinum toxin substrate 1 (RAC1)). (B) The diagrams show the atlas of mouse brain coronal sections for the striatum, and the coordinates of the exact areas where immunohistochemistry (IHC) experiments were performed (left panel). The green boxes indicate regions of interests (ROIs). Representative IHC images show expression of the EGFP-Shank3 proteins in the dorsal striatum of Shank3 TG, but not WT, mice (right panel). DL, dorsolateral; DM, dorsomedial; DV, dorsoventral. Scale bar, 500 μm. (C) Representative IHC images and quantification show increased levels of F-actin in the DV, but not DM and DL, compartments of Shank3 TG striatum. Scale bar, 500 μm. Data are presented as mean ± SEM (n = 7 animals per genotype; *P < 0.05, unpaired two-tailed Student’s t-test). (D) Western blot images show co-immunoprecipitation (IP) of EGFP-Shank3, Rhes, WAVE1, and Homer1b/c proteins from the Shank3 TG, but not WT, synaptosomal lysate. For input and flow-through (F/T) lanes, 0.5% of total proteins were loaded.
