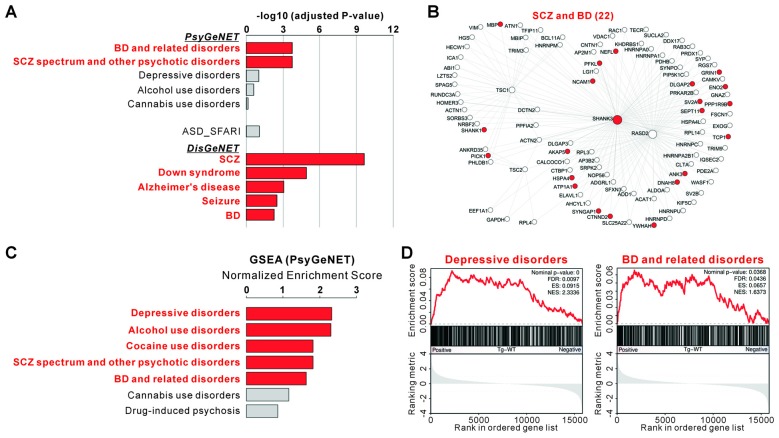
Figure 4.
Associations of the Shank3-mTORC1 interactome and Shank3 TG striatal transcriptome with the disease. (A) Disease association analysis for the 94 genes in Shank3-mTORC1 interactome. Significant disease terms (Benjamini adjusted P value < 0.05) are in bold red. The complete analyses are provided in Supplementary Tables S8, S9. (B) The Shank3-mTORC1 interactome network with bipolar disorder (BD)- and schizophrenia (SCZ)-associated proteins from Psychiatric disorders Gene association NETwork (PsyGeNET) database colored in red. (C) The bar graph shows the Normalized Enrichment Scores (NESs) of GSEA on the PsyGeNET gene sets for the striatal RNA-seq analysis of Shank3 TG mice. Significant disease terms are in bold red. The complete list of GSEA is provided in Supplementary Table S10. (D) The enrichment plots showing the striatal RNA-seq analysis of Shank3 TG mice on the PsyGeNET gene sets of “depressive disorders” (left panel) and “BD and related disorders” (right panel).

