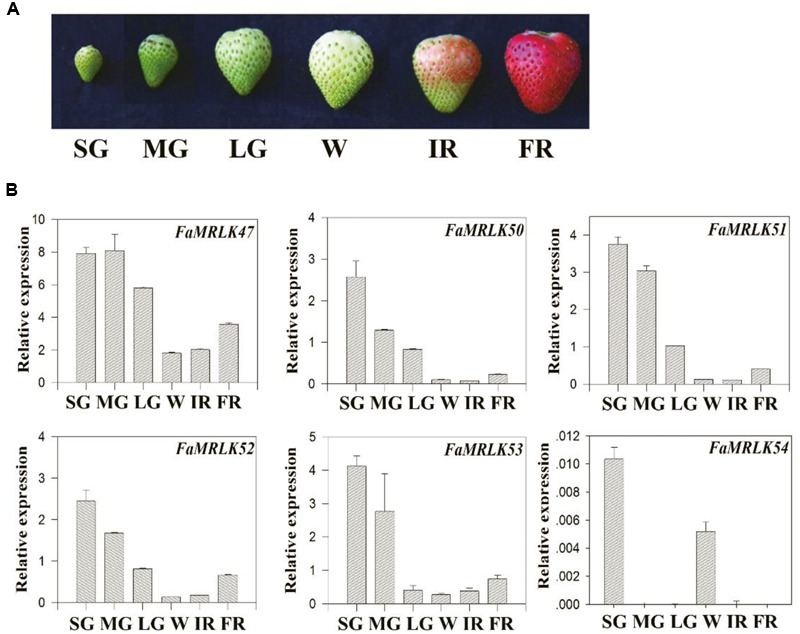
FIGURE 2.

Temporospatial pattern of FaMRLK expression in strawberry fruits. (A) Phenotypes of strawberry fruit at different developmental stages: small green (SG), middle green (MG), large green (LG), white (W), initial reddening (IR), and fully reddening (FR). (B) Quantitative reverse transcriptase PCR (RT-qPCR) analysis of the expression of various FaMRLK genes at the indicated developmental stages. Labels below bars denote the corresponding developmental stages, as in (A). FaACTIN was used as an internal control. Values are means ± SD of three biological replicates.
