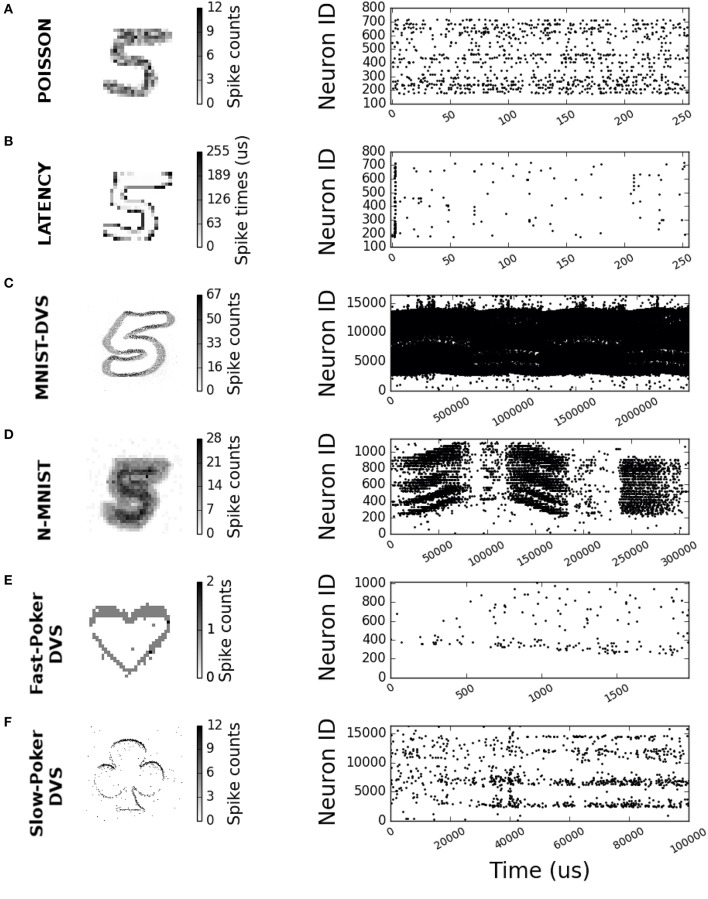
Figure 1.
2-D histograms and raster plots for different encoding schemes and neuromorphic data sets. (A) Poisson 28 × 28 input size sample. (B) Latency 28 × 28 input size sample. (C) MNIST-DVS 128 × 128 input size sample. (D) N-MNIST 34 × 34 input size sample. (E) Fast-Poker DVS 32 × 32 input size sample. (F) Slow-Poker DVS 128 × 128 input size sample.

