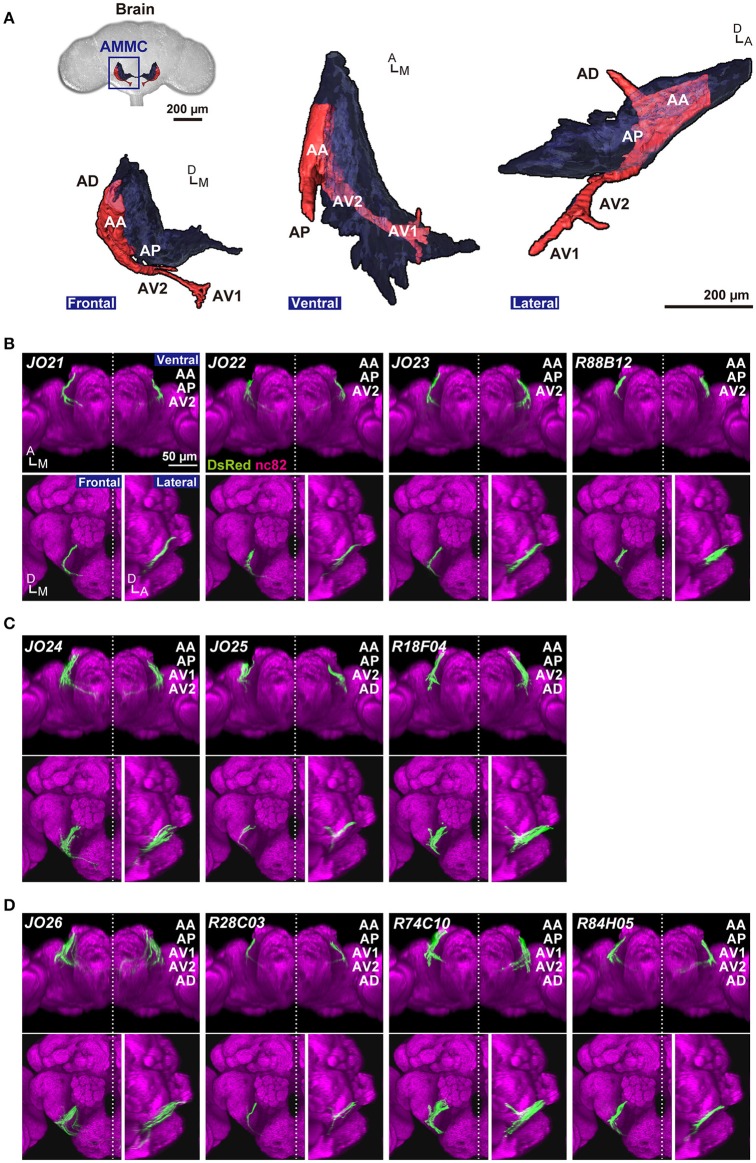
Figure 1.
Anatomy of JO-A neurons. (A) Frontal, ventral, and lateral views of 3D-reconstructed AMMC zone A in a fly brain. Zone A and other AMMC zones are shown in red and black, respectively. Five subareas in the zone A (subareas AA, AP, AV1, AV2, and AD) represent the projection target of JO-A neurons in the brain. (B–D) GAL4 strains that label JO-A neurons (JO-A GAL4 strains). Labeled subareas in each strain are shown at the upper-right of the panel. Ventral, frontal, and lateral views of the brain of each strain that labels three (B), four (C), and five subareas (D) are shown. All images were registered to a template brain. Green and magenta signals show the DsRed-labeled neurons and nc82-labeled neuropils, respectively. Signals of cells that were not relevant to JO-A neurons were manually erased from the original images for clarity. Original labeling patterns are shown for JO strains (Kamikouchi et al., 2006) and FlyLight database (http://flweb.janelia.org/cgi-bin/flew.cgi) for FlyLight strains. A, anterior; D, dorsal; M, medial. Images in panel (A) were modified from Ishikawa and Kamikouchi (2016) with permission.

