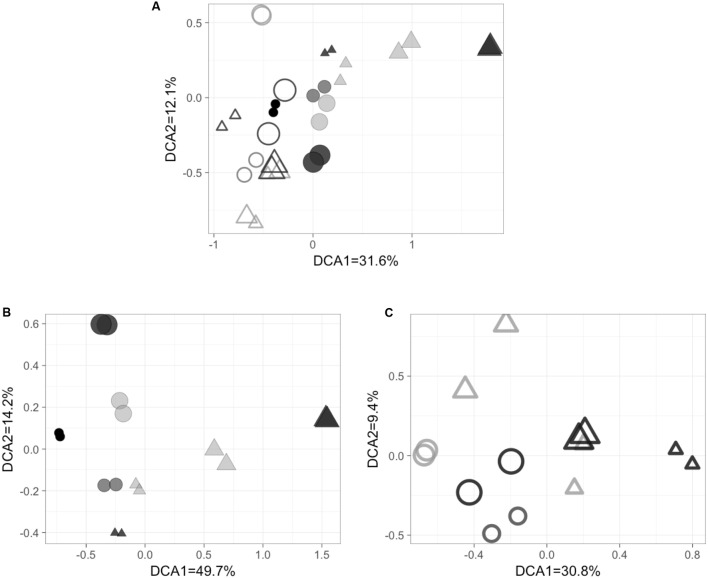
FIGURE 4.
Detrended correspondence analysis (DCA) results of (A) total and active nosZ genes, (B) the total genes only and (C) the active genes only. Filled symbol stands for total nosZ genes, open symbol stands for active nosZ genes. Circles = off-shore station BB1 and triangles = coastal station BB2. The symbol size represents depths (the larger, the deeper). Symbol color represents O2 concentration (the darker, the higher). Symbols with the same shape, color and size were duplicates. Three pairs of symbols in lightest gray in (B) indicates samples from the ODZ with O2 concentration under detection limit.

