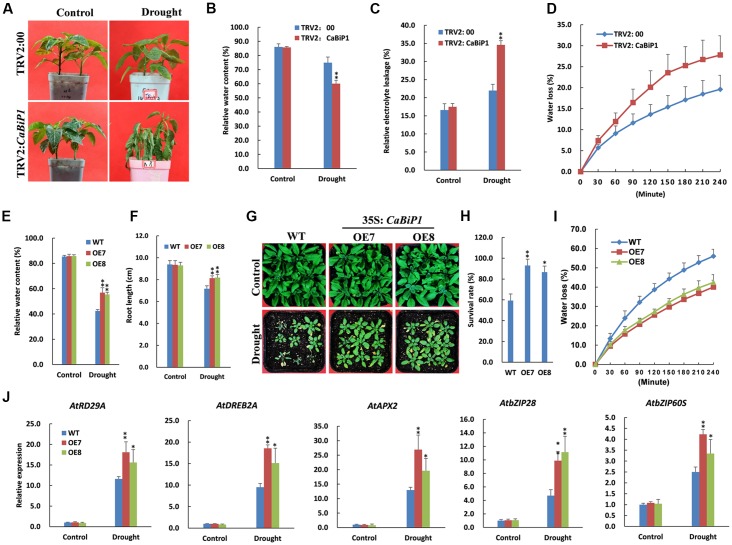
FIGURE 10.
Altered drought tolerance in CaBiP1-silenced and CaBiP1-overexpressing plants. (A–C) Symptoms, RWC and REL in the leaves of TRV2:CaBiP1 and TRV2:00 pepper seedlings grown under drought stress performed by withholding water for 10 days. (D) Water loss rate of detached leaves from pepper TRV2:CaBiP1 and TRV2:00 seedlings. (E,F) RWC and root length of WT and CaBiP1-OE lines grown under drought stress by withholding water for 12 days. (G,H) Survival rate of WT and CaBiP1-OE lines grown under drought stress by withholding water for 12 days then rehydrated for 2 days. (I) Water loss rate of detached leaves from WT and CaBiP1-OE seedlings. (J) Expression of drought stress- and ER stress-related genes in the leaves of WT and CaBiP1-OE lines grown under drought stress by withholding water for 10 days. AtActin2 was used as the internal control gene. Data are the mean ± standard deviation from three biological replicates. Statistical significance is indicated by a single asterisk (p < 0.05) and a double asterisk (p < 0.01) based on the Student’s t-test.

