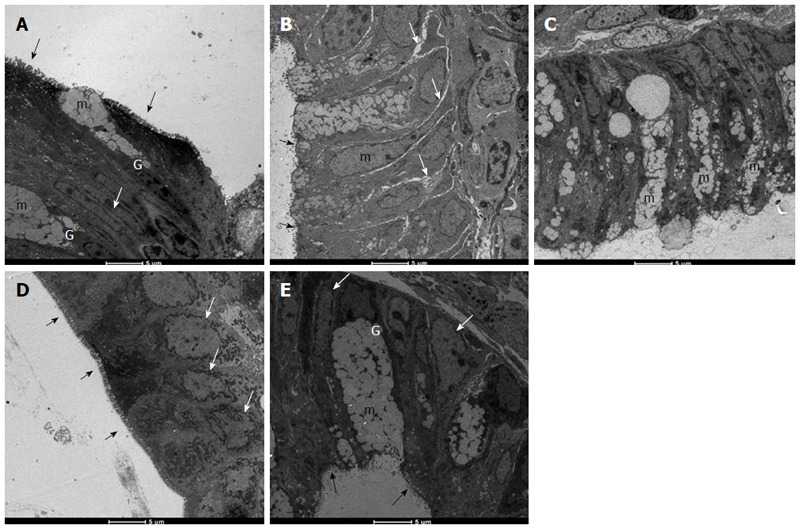
Figure 4.

Electromicrographs (transmission electron microscopy) of colon samples from different experimental groups. Goblet cells (G), mucus granules (m); Microvilli (black arrows); nucleus in a basal position (white arrow); edema (grey arrows). In A (non-colitic group): colonic goblet cells (G) showing the mucus granules (m); absorptive epithelial cells with a well-developed brush border containing numerous regular microvilli (black arrows) typical of enterocytes and its nucleus in a basal position (n) shows chromatin (white arrow); In B (TNBS control group): mucin granules in colonic goblet cells are reduced and disarranged (m); surface cells have no distinct brush border with atypical microvilli (black arrow); the intercellular space was enhanced as a signal of edema (white arrows); In C (PACO2 25 mg/kg-treated group): mucin granules in colonic goblet cells are reduced and disarranged (m), but intercellular edema is reduced (white arrows); In D (PACO2 50 mg/kg-treated group): juxtaposed colonocytes with nucleus in basal position (white arrows) and preserved microvilli (black arrows); In E (PACO2 100 mg/kg-treated group): goblet cells (G) showing the mucus granules (m) similar to healthy animals; nucleus in basal position (yellow arrows); mild intercellular edema and atypical microvilli (black arrows).
