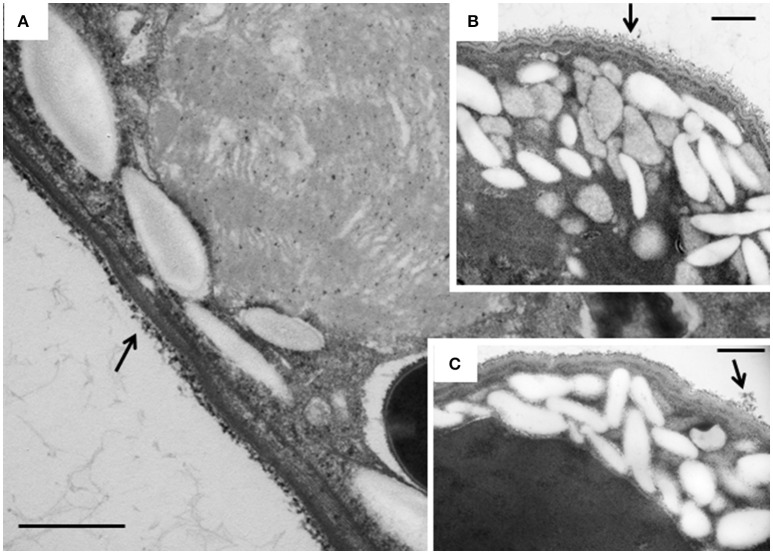
Figure 7.
TEM micrographs of the cortex of E. caudatum cells. (A) untreated E. caudatum cells; (B) carbenicillin (1 mg/ml, for 48 h) treated cells; (C) Normocin™ (0.1 mg/ml, 24 h) treated cells. External filamentous glycocalyx (arrows) covering the cortical layers of E. caudatum cells showed morphological disparity between antibiotics-treated and untreated cells. The scale bars = 500 nm.

