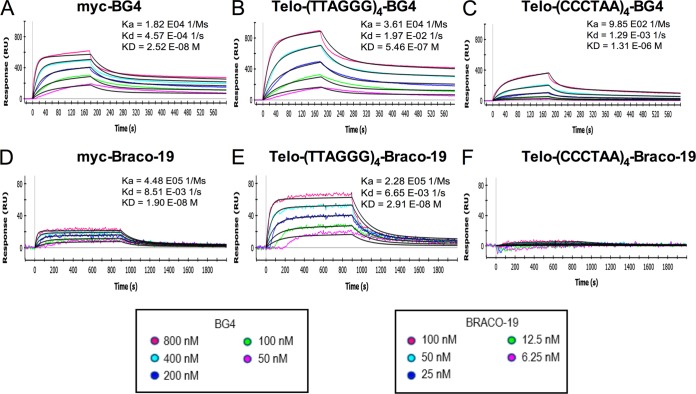
FIG 2.
Association and dissociation curves of ligands (BG4 and BRACO-19) to the DNA oligonucleotides by surface plasmon resonance. Curves of the association and dissociation over time between the ligands (BG4 antibody and BRACO-19) and the DNA sequences [myc promoter, Telo-G-rich telomere (TTAGGG)4, and C-rich telomere (CCCTAA)4], corresponding to association (Ka), dissociation (Kd), and equilibrium (KD) constants. Curves with BG4 (0 nM to 800 nM) are shown in panels A to C, and curves with BRACO-19 (0 nM to 100 nM) are in panels D to F.

