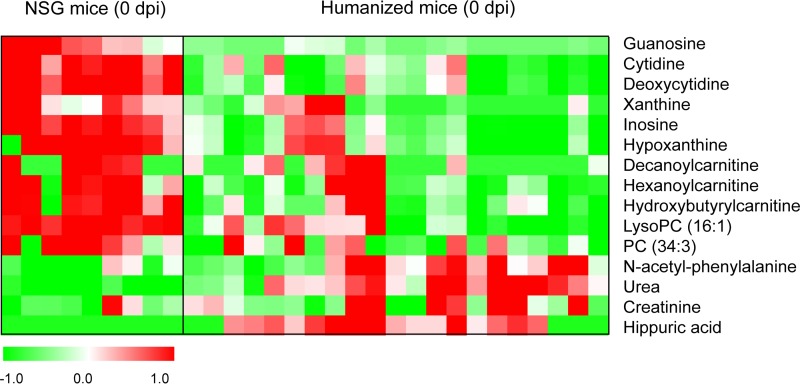
FIG 2.
Heat map of identified differential metabolites between humice and NSG mice without dengue infection. Each row shows the ion intensity for a specific metabolite after mean centering and unit variance scaling of the data. Each column shows the serum metabolic profiles of humice and NSG mice at 0 dpi.

