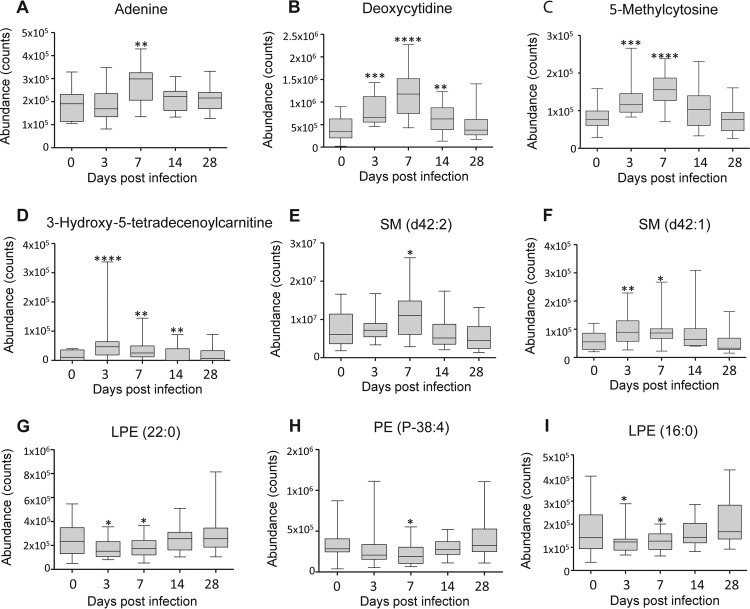
FIG 4.
Typical change trends based on differential metabolite classes in humice with dengue infection. (A) Elevated change trend of adenine (purine). (B) Elevated change trend of deoxycytinine (pyrimidine). (C) Elevated change trend of 5-methylcytosine (pyrimidine). (D) Elevated change trend of 3-hydroxy-5-tetradecenoylcarnitine (acylcarnitine). (E) Elevated change trend of SM d42:2 (sphingolipid). (F) Elevated change trend of SM d42:1 (sphingolipid). (G) Decreased change trend of lyoPE (LPE) 22:0 (phospholipid). (H) Decreased change trend of PE P-38:4 (phospholipid). (I) Decreased change trend of LPE 16:0 (phospholipid). The bottom and the top of each box are the 25th and the 75th percentiles, and the black line near the middle of the box is the median peak area of the metabolite. *, P < 0.05; **, P < 0.01; ***, P < 0.001; ****, P < 0.0001 by the Kruskal-Wallis test. The statistical comparison was with control levels. Whiskers are from minimum to maximum.

