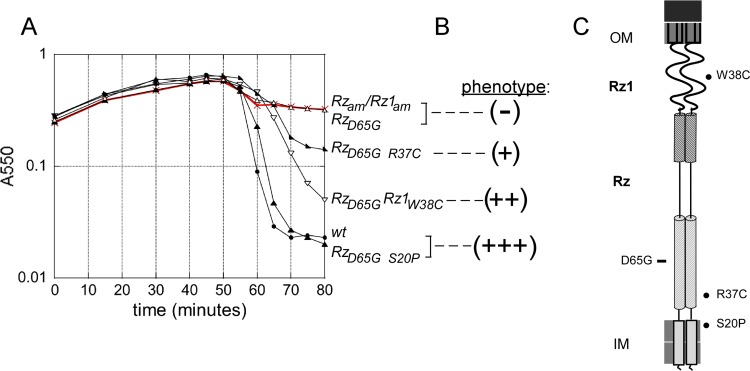
FIG 6.
Subset of lysis profile data used to assess lysis phenotype. (A) The following MDS12 lysogens were induced at time 0 and monitored at A550: Rzam Rz1am (red), λ900 Rzam Rz1am; RzD65G, λ910 RzD65G; RzD65G R37C, λ910 RzD65G, R37C; RzD65G Rz1W38C, λ910 RzD65G Rz1W38C, RzD65G S20P, λ910 RzD65G, S20P; wt, λ910. (B) Categorization of lytic phenotype is denoted with respect to the lysis profile traces. (C) Cartoon of the spanin complex within the cell envelope. The relative position of the inactivating RzD65G mutation is marked with a rectangle to the left of the cartoon. At right are shown the relative positions of suppressors generated from RzD65G, marked with a filled circle.

