
Fig. 2.
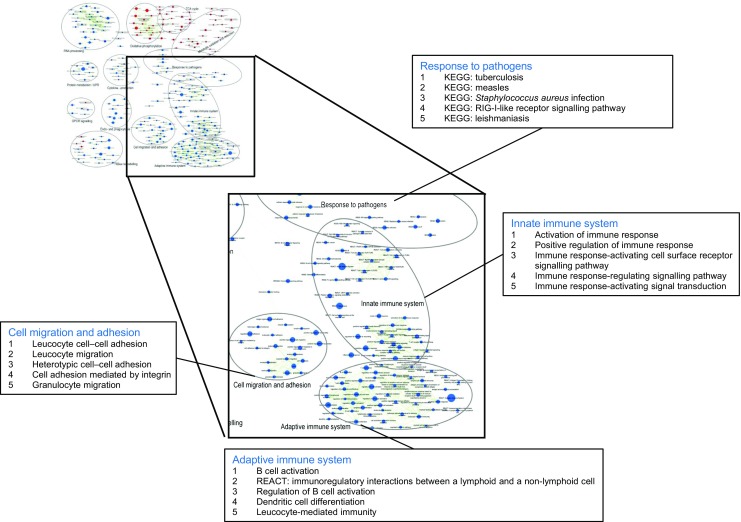
Absence of SUCNR1 reduces inflammatory pathways within adipose tissue. Enrichment map zooming in on four differentially regulated pathways in adipose tissue from Sucnr1 −/− vs WT mice. A larger version of the enrichment map is shown in ESM Fig. 3. Gene set enrichment analysis was performed to identify functional gene sets (i.e. metabolic pathways or signalling transduction routes) that were changed in Sucnr1 −/− mice (p < 0.001, false discovery rate [FDR] < 0.25). Nodes represent gene sets. A red node indicates induction of a gene set in Sucnr1 −/− compared with WT, whereas a blue node indicates suppression of a gene set. Node size represents the gene set size. Gene sets were grouped by cluster analysis, applying the Markov cluster algorithm. For four specific clusters related to inflammation, the five most significant gene sets are shown. KEGG, Kyoto Encyclopedia of Genes and Genomes (www.genome.jp/kegg/); REACT, Reactome (www.reactome.org/); RIG-I, retinoic acid-inducible gene I