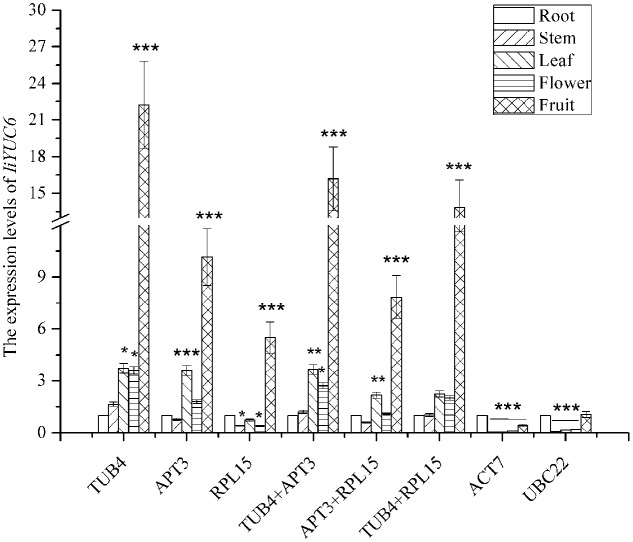
FIGURE 5.
Relative expression levels of IiYUC6 in different tissues (root, stem, leaf, flower, and fruit) were normalized using different reference genes or a combination including the three most stable (TUB4, APT3, and RPL15) and two least stable genes (ACT7 and UBC22). Error bars show the mean standard error calculated from three biological replicates. The statistical level was assessed with ∗P < 0.05, ∗∗P < 0.01, and ∗∗∗P < 0.001.

