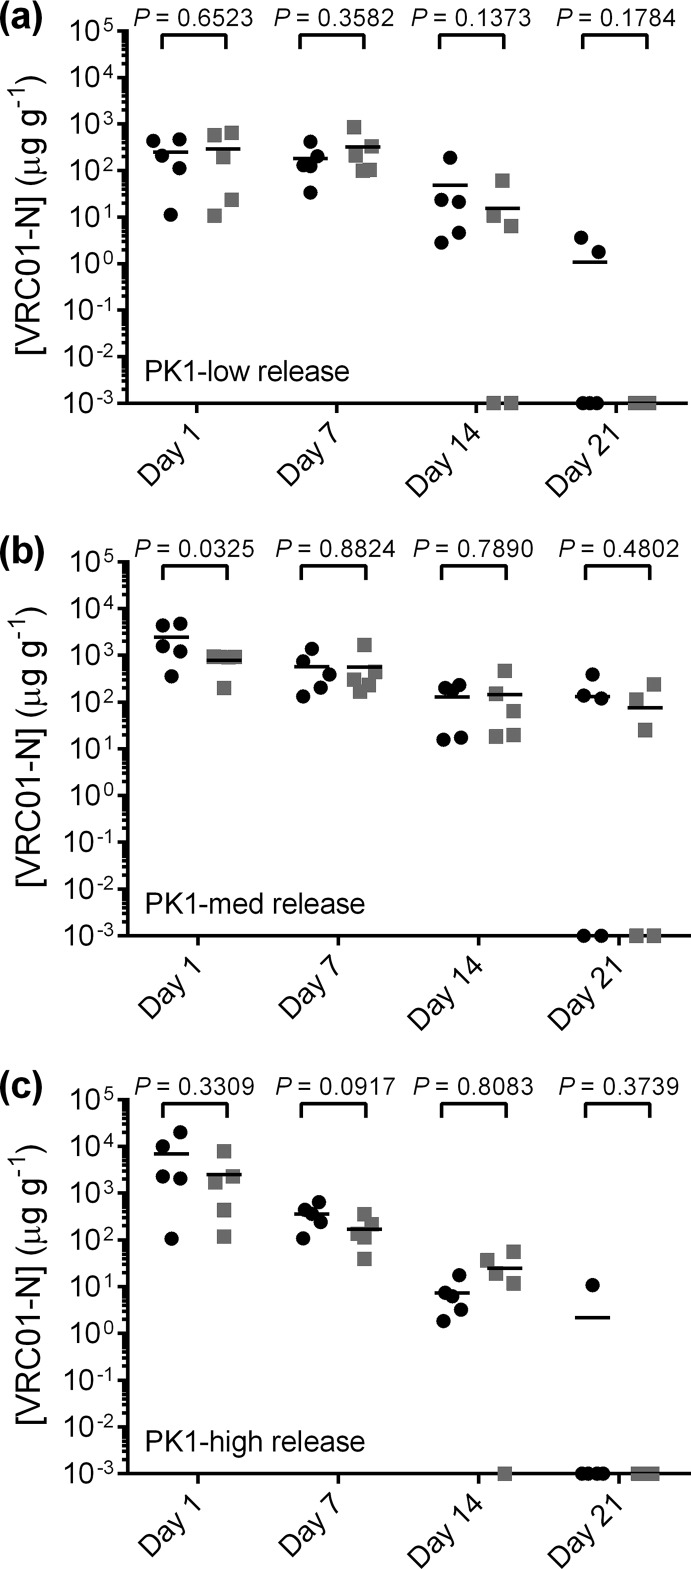
FIG 5.
Plot of cervicovaginal lavage (CVL) fluid concentrations of VRC01-N obtained at each sampling interval in study PK1. Each data point represents the data for each animal (n = 5), and horizontal bars represent the median values for each group: high release (green), medium release (blue), and low release (red).

