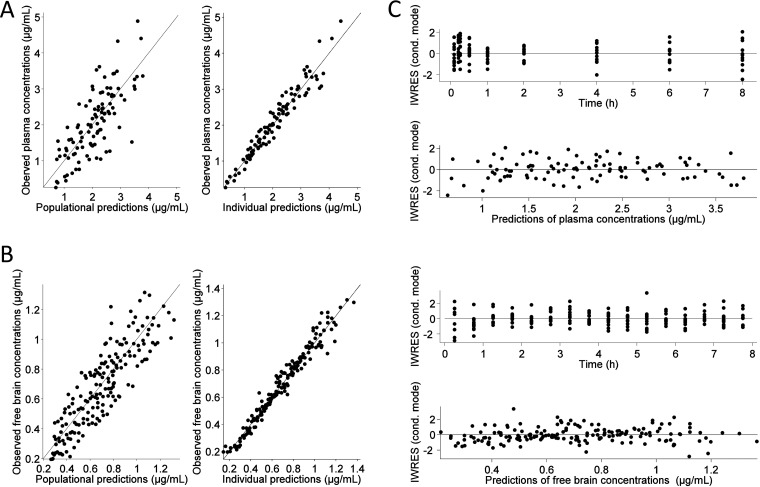
FIG 2.
Goodness-of-fit plots for VCZ total plasma (A) and free brain (B) concentrations. In the plots of observations versus populational predictions and observations versus individual predictions, the gray line represents the linear regression fit and the black line is the identity line. In the graphs on the right (C), the residual plots are shown in which a black line is the LOESS smooth fit representing the trend in the data.

