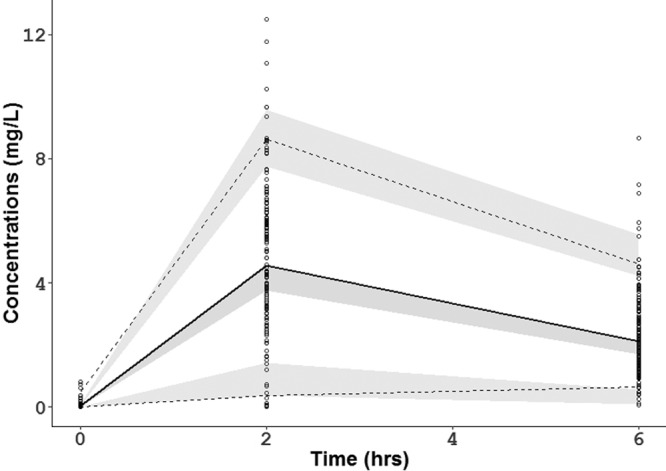
FIG 1.

Visual predictive check for the final rifampin model. The lower, middle, and upper lines are the 5th percentile, the median, and 95th percentile for the observed data, respectively. The shaded areas are the 95% confidence intervals for the 5th percentile, the median, and the 95th percentile for the simulated data.
