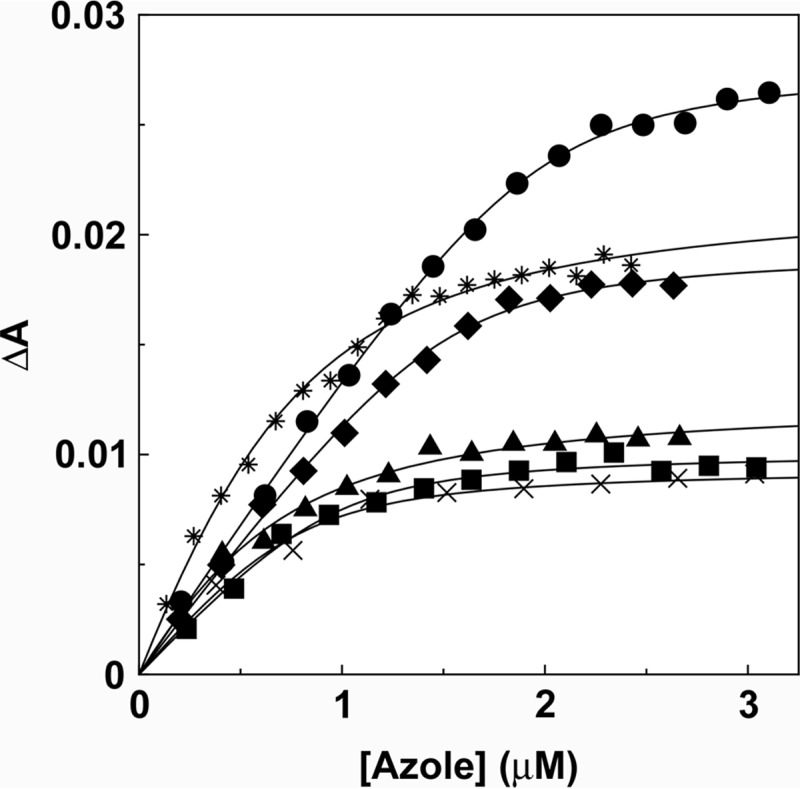
FIG 6.

Azole binding saturation curves for Trub51. Saturation curves were constructed from the absorbance difference (ΔApeak-trough) of the type II difference spectra (Fig. 5) for clotrimazole (circles), fluconazole (squares), voriconazole (triangles), itraconazole (diamonds), ketoconazole (asterisks), and VT-1161 (crosses). A rearrangement of the Morrison equation (25) was used to fit the tight ligand binding observed. Each experiment was performed in triplicate, although only one replicate is shown.
