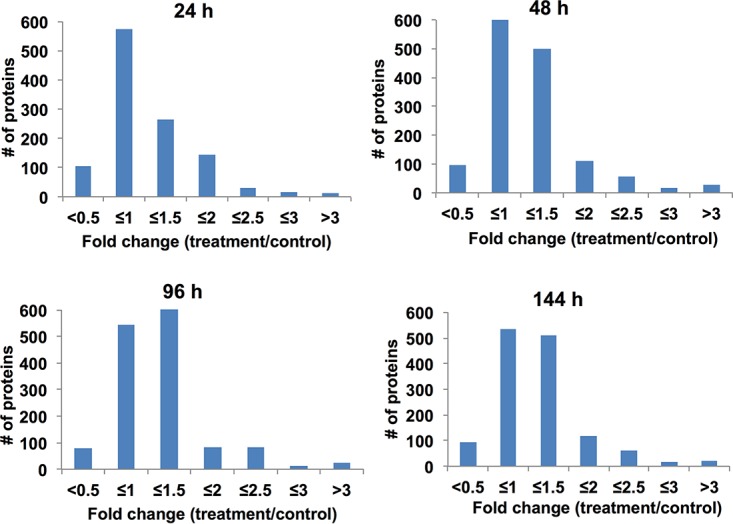
FIG 2.

Fold changes of differentially expressed M. tuberculosis proteins. The histograms show the distributions of fold changes of differentially expressed proteins across all the drugs over 6 days of treatment. The fold change was calculated by dividing the expression level in protein overexpression in drug-exposed samples by that in the control sample without any treatment.
