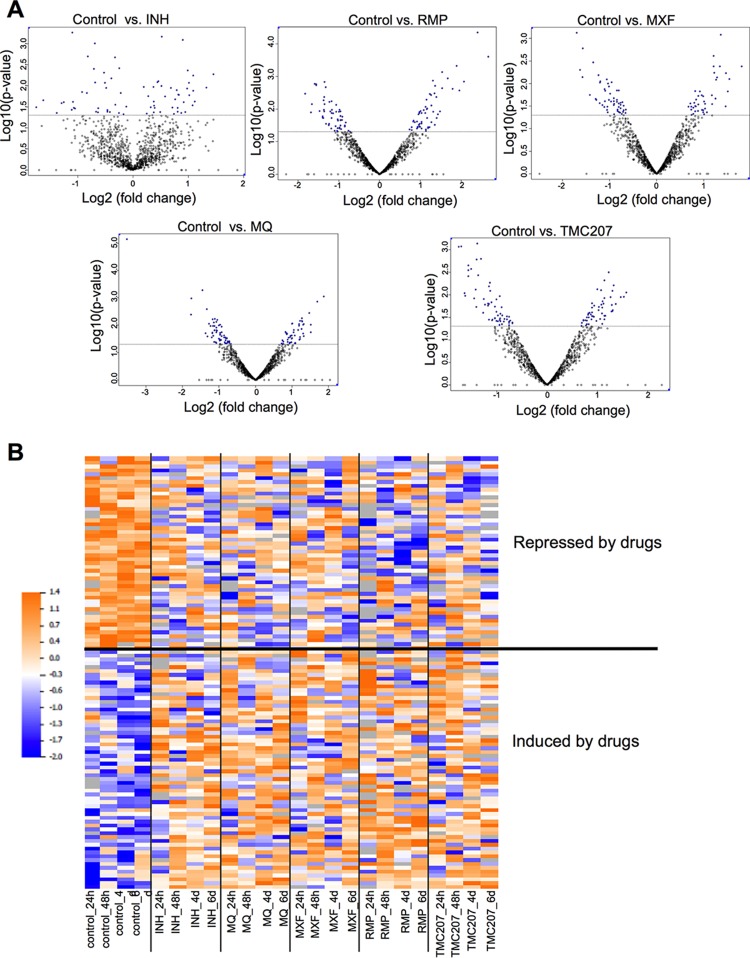
FIG 3.
Proteome response of M. tuberculosis to anti-tuberculosis drug treatments. (A) Volcano plots showing proteins that are induced or repressed by each drug across all time points. Proteins with P values of <0.05 are in blue; each dot is one protein. (B) Heat map showing the levels of proteins that were concordantly regulated across four time points by the five drugs. Raw values were log2 transformed and normalized within each protein. The colors show relative levels as indicated by the scale bar.

