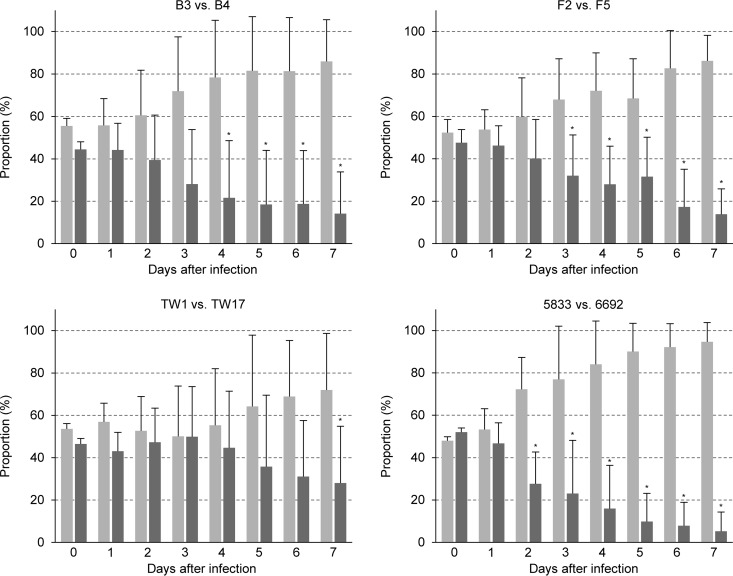
FIG 4.
Competitive fitness of fluconazole-susceptible isolates F2, B3, 5833, and TW1 (light gray bars) and matched fluconazole-resistant isolates F5, B4, 6692, and TW17 (dark gray bars), respectively, in a mouse model of gastrointestinal colonization. In each case, the susceptible isolate was mixed with two independently generated RFP-labeled derivatives of the matched resistant isolate and the resistant isolate was mixed with two independently generated RFP-labeled derivatives of the matched susceptible isolate. For all comparisons, each of the four mixtures was used to infect 3 mice (4 mice were infected with the 5833/6692ADH1R1A and TW1/TW17ADH1R1A pairs); i.e., the competitive fitness of each isolate pair was tested in 12 mice (13 mice for 5833/6692 and TW1/TW17). Shown are the relative proportions of the strains in the inoculum (day 0) and in samples recovered at the indicated times from the feces of the animals. Results are the means and standard deviations from the 12 (or 13) coinfection experiments. Significant differences in the proportions of resistant isolates after passage through the gastrointestinal tract compared to the inoculum are indicated by asterisks (P < 0.05). See Data Set S4 for details.

