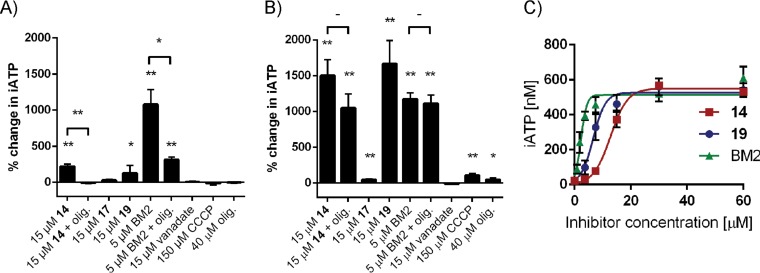
FIG 5.
Pma1 inhibitors increase iATP levels in S. cerevisiae (A) and C. albicans (B and C). The total cellular ATP concentrations were determined after 30 min of treatment. The mean data (n = 3) with the SD are indicated as the percent change compared to that for the untreated control sample (1% DMSO) (A and B) or as the concentration (in nanomolar) of iATP (C). olig., oligomycin A (at 40 μM in all panels). *, P < 0.05 compared to the untreated control by unpaired t test; **, P < 0.01 compared to the untreated control by unpaired t test.

