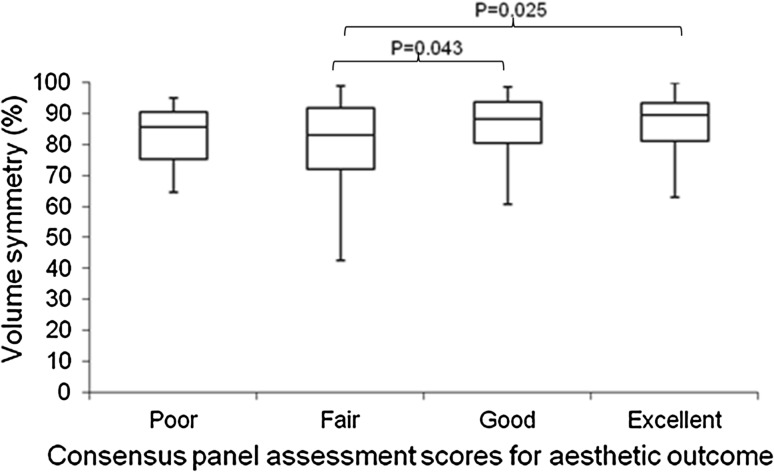
Fig. 4.
Box and whisker plot demonstrating volume symmetry (%) according to consensus panel assessment of aesthetic outcome. The horizontal lines within each box represent median scores, the outer horizontal lines of each box represent upper and lower quartiles, and the ends of the vertical lines represent minimum and maximum scores. On post hoc pair wise comparisons there was a significant difference in volume symmetry when comparing ‘fair’ with ‘good’ and ‘fair’ with ‘excellent’ panel scores. The other comparisons were not significant

