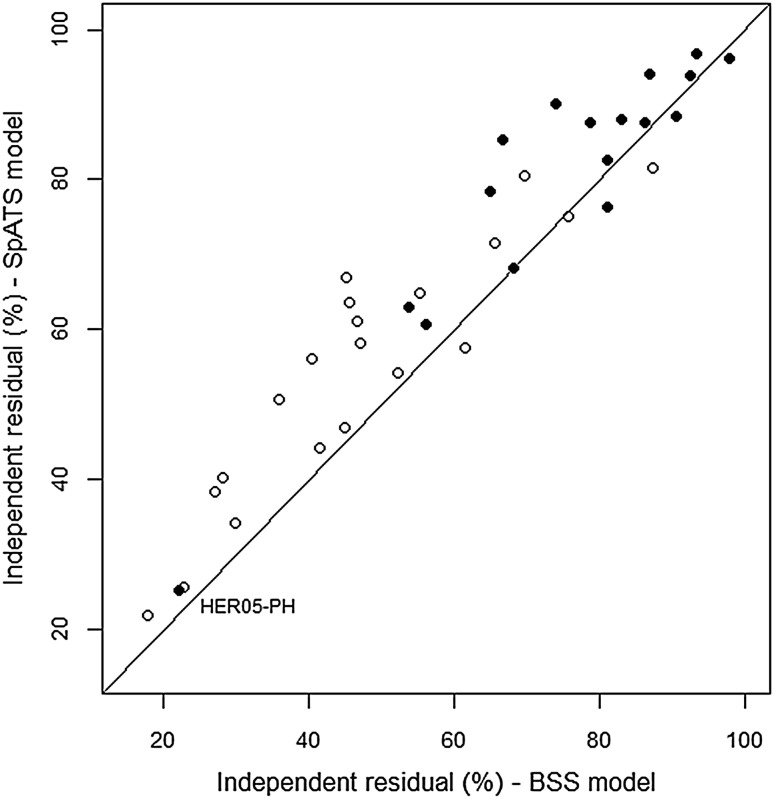
Fig. 4.
Comparison of spatially independent residual variance () from the BSS and the SpATS models, expressed as percentage (%) of the residual variance in the non-spatial model, for grain yield (open circle) and plant height (filled circle). The diagonal line indicates identical values. The labelled data point corresponding to plant height at trial HER05 (HER05-PH) is mentioned in the text

