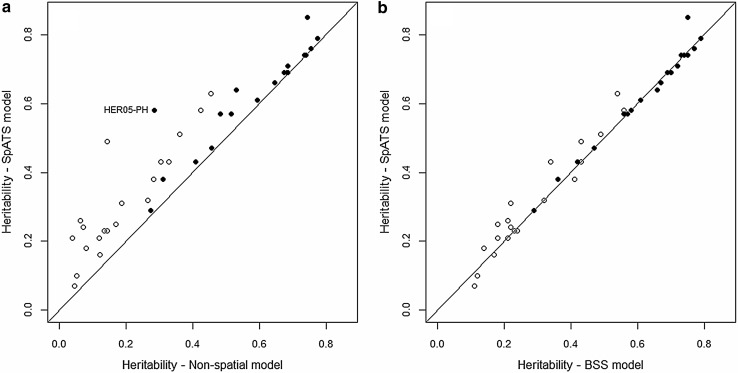
Fig. 5.
Comparison between estimates of heritability from the non-spatial and SpATS models (a), and from SpATS and the BSS models (b) for grain yield (open circle) and plant height (filled circle). The diagonal lines indicate identical values. The labelled data point corresponding to plant height at trial HER05 (HER05-PH) is mentioned in the text

