
Fig. 4.
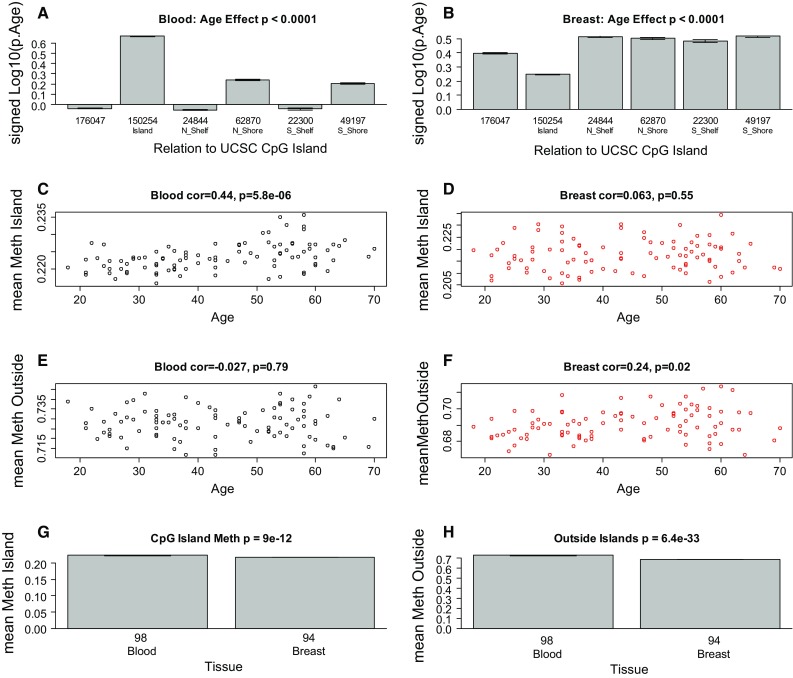
DNA methylation levels inside and outside of CpG islands. a Effect of chronological age on CpG methylation versus chromosomal location in a blood and b breast tissue. The y-axis of the bar plot shows the log (base 10)-transformed correlation test p value (whose sign reflects the sign of the correlation). c, d Mean methylation levels in CpG islands versus chronological age in c blood and d breast tissue. e, f Mean methylation levels outside of CpG islands versus chronological age in e blood and f breast tissue. g Mean methylation in CpG islands versus tissue type. h Mean methylation outside of CpG islands versus tissue type