Figure 10.

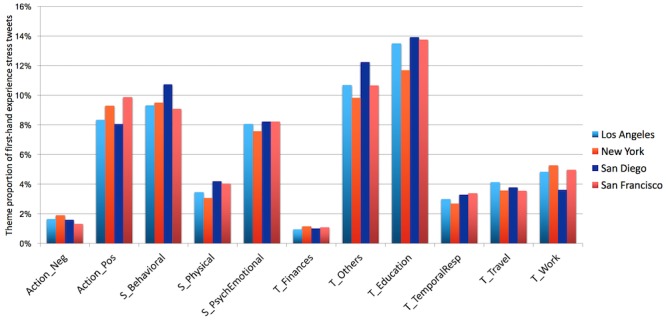
Stress theme distribution by each of the 4 cities in dataset 2. There are no significant differences between cities (P>.05). Neg: negative; Pos: positive; S: symptoms; T: topics.

Stress theme distribution by each of the 4 cities in dataset 2. There are no significant differences between cities (P>.05). Neg: negative; Pos: positive; S: symptoms; T: topics.