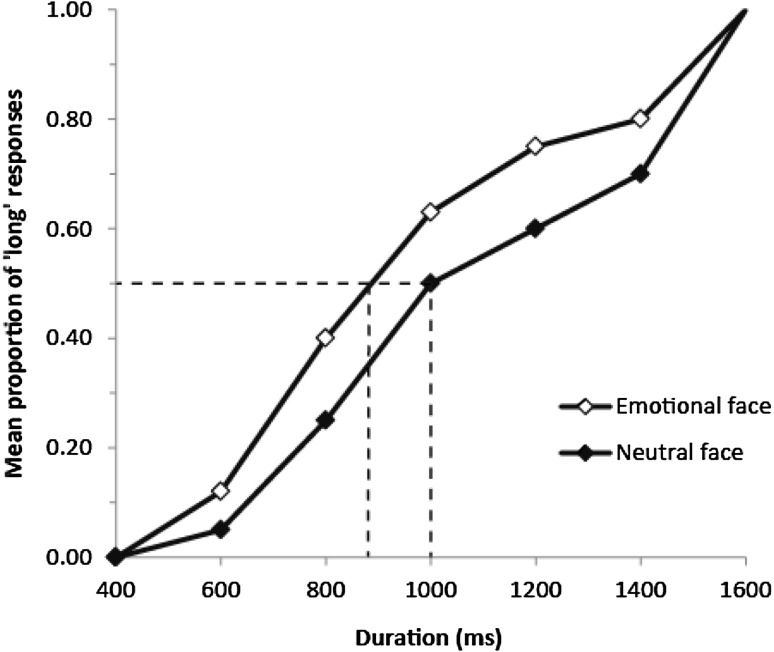
Fig. 1.
Hypothetical psychophysical functions to illustrate the effect of emotional stimuli on duration judgements in the temporal bisection task. The mean proportion of long responses is plotted against stimulus duration. The leftward shift of the emotional face data along the x axis illustrates the response bias towards long responses. Dashed lines illustrate the bisection point (x axis), which is the plotted duration where 50% of responses are long (y axis) (see Method for further explanation)

