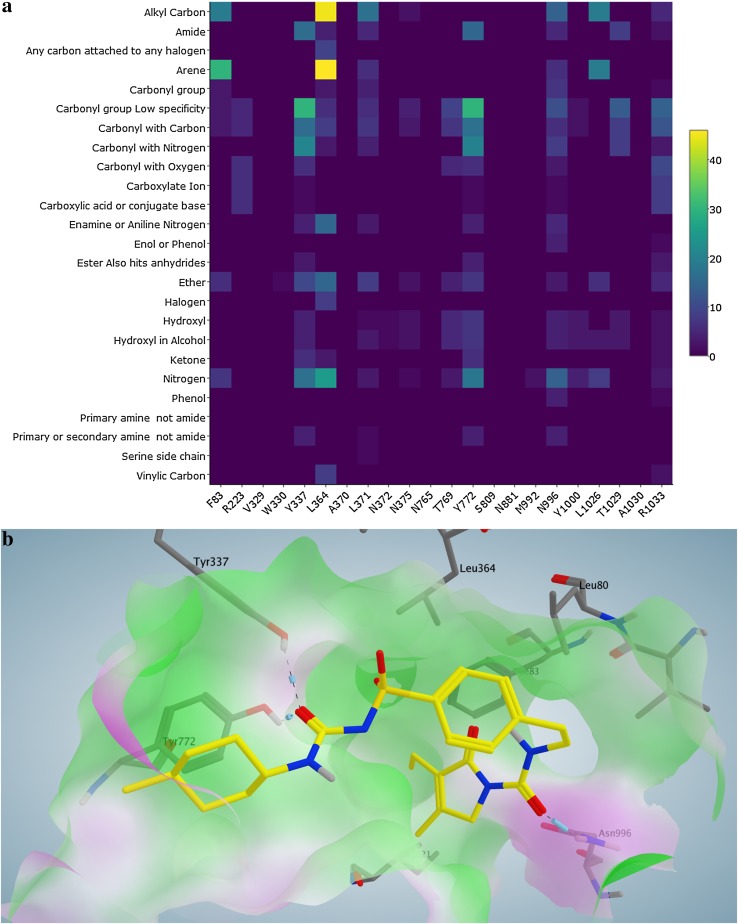
Fig. 8.
a Heat map illustrating the PLIF analysis of the training set inhibitors (x-axis contact residues; y-axis functional groups of the ligand showing an interaction with the residue; color scale number of interacting ligands). b Docking pose of Glimepiride (yellow) in which its carbonyl groups interact with the residues Tyr337, Tyr772 and Asn996

