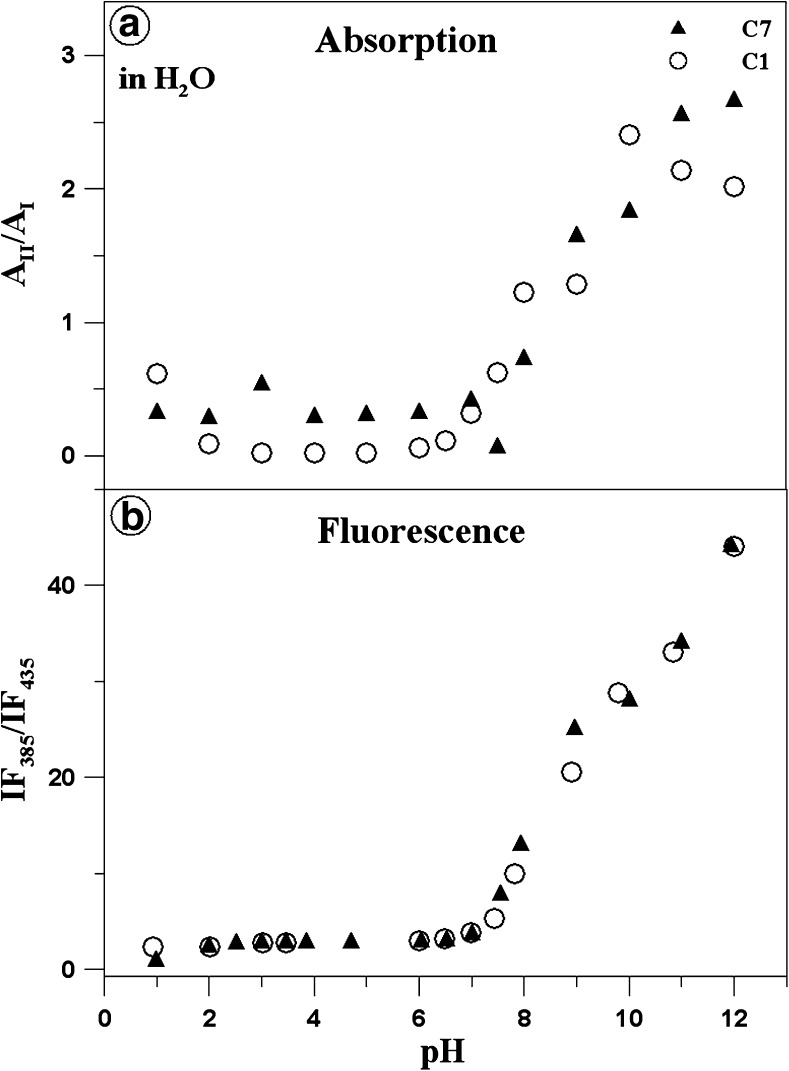
Fig. 2.
Panel A presents the ratio of the maximum electron absorption at ca. 360/313 nm for C1 (white circles) and at 361/314 nm for C7 (black triangles), i.e. the ratio between the predominant monomeric form (ionised with the –O− group) and the predominant associated form for a given compound (ionised with the –N-H+ group) depending on the pH of the aqueous solution. Panel B shows the ratio of the fluorescence emission intensity for C1 (white circles) and C7 (black triangles) depending on changes in the pH of the aqueous solution. The points were read from the absorption and fluorescence emission spectra presented in Fig. 1. The measurements of the absorption and electron fluorescence spectra, from which the respective absorption and fluorescence maxima were read

